 Reproduced, with permission, from:
Kalkstein, L. S., and K. M. Valimont. 1986. An evaluation of summer discomfort in the United States using a relative climatological index. Bulletin of the American Meteorological Society 7: 842-48.
Reproduced, with permission, from:
Kalkstein, L. S., and K. M. Valimont. 1986. An evaluation of summer discomfort in the United States using a relative climatological index. Bulletin of the American Meteorological Society 7: 842-48.
A relative climatological index is developed to evaluate interregional variations in human discomfort and the impacts of weather on a variety of socioeconomic parameters. The "weather stress index" is designed to assess the frequency and magnitude of the most uncomfortable weather conditions, and data inputs are limited to air temperature, dewpoint, and wind speed. The index is constructed by calculating the apparent temperature using a simple algorithm and comparing how a particular day's apparent temperature varies from the mean for that day at that locale. The index ranges from 0 percent to 100 percent, with the most uncomfortable apparent temperatures exhibiting the highest values.
A geographical distribution of July apparent temperatures at the 95 percent and 99 percent weather-stress-index level indicates that the central and south central United States experience the highest apparent temperatures in the nation. These conditions occur when the surface flow permits maritime air to intrude while a 500-mb ridge is present to encourage atmospheric subsidence. The combination of these events almost never occurs in the Desert Southwest, and the highest apparent temperatures here do not reach the levels encountered in the central United States.
The use of the weather stress index should enhance interregional evaluation and facilitate the development of large-scale models for analyses of numerous climate-impact relationships.
Over the past several years, a large body of climatological research has been devoted to the development and improvement of indices which attempt to measure human discomfort (Quayle and Doehring, 1981; Steadman, 1979a, 1979b). Although several approaches have dealt with the evaluation of winter discomfort (Court, 1981), most of the indices evaluate the impact of heat stress on the individual and take into account temperature, humidity, or a combination of the two. The names of such indices are imaginative and include humiture, humidex, humisery, apparent temperature, the weather stress index, the discomfort index, and the temperature-humidity index (Thom, 1959; Lally and Watson, 1960; Masterson and Richardson, 1979; Winterling, 1979: Kalkstein, 1982; Weiss, 1983; Steadman, 1984).
A limited number of these indices have enjoyed widespread popularity and some are published routinely by the National Oceanic and Atmospheric Administration (NOAA) in a variety of formats. Several of the indices have been utilized in climate-assessment research and have uncovered relationships that were previously indeterminable when using raw weather data alone. However, their utility has been hampered somewhat because virtually all of the developed indices are absolute rather than relative (Kalkstein, 1983). An absolute discomfort index is place specific in its utility, as an apparent temperature of 40degC might hamper human activities in Minneapolis but have a minimal effect in Phoenix. However, a relative index compares a particular value to normal for a given locale and evaluates how unusual that event might be. If discomfort indices are to be applied on a larger geographical scale, it is necessary to develop relative values to permit interregional evaluation of discomfort-related events such as human morbidity and mortality, employee absenteeism, and crime.
The objective of this study is to describe a relative climatological index which has utility in evaluating human discomfort. A national evaluation of the magnitude of the index during the summer will be presented, and the places in the United States which possess the most extreme index values will be isolated.
The need to develop a relative index which facilitates interregional comparisons has led to the development of the weather stress index or WSI (also called "relative apparent temperature" in NOAA publications), which compares the relative frequencies of certain weather conditions across the country (U.S. Department of Commerce, 1983). The index assumes that human behavioral response to weather is often relative rather than absolute, a notion that is supported by many but refuted by others. For example, several studies on human mortality suggest that geographical acclimatization is a significant factor and that people make certain behavioral and cultural adjustments to lessen the impact of weather depending on where they live (Rotton, 1983; Ellis, 1972; Kilbourne et al., 1982). However, other research contends that human response is absolute, and this response will be considerable during very hot and cold weather no matter how frequently these events occur (Jones et al., 1982). Siple's windchill index implies that absolute conditions are more significant than relative, as his algorithms are based on measurements taken in polar environments and are applied to weather data across the United States (Siple, 1945; Court, 1981).
Our own research strongly supports the contention that human behavioral response to weather is more often relative rather than absolute. In an evaluation of the impact of weather on human mortality, winter mortality rates rose significantly on days when temperatures did not exceed 0degC in Atlanta. However, no increases in death rates were noted in Minneapolis even at temperatures approaching -35degC (Kalkstein and Davis, 1985). In general. winter mortality rates in southern cities were more sensitive to temperature than rates in northern cities. A recent study comparing worker absenteeism rates to winter snowfall also suggested that relative, rather than absolute, weather events were more important. The results indicated that absenteeism is likely to be much higher during and after snowstorms in cities where snow is less common (Tan and Davis, 1986).
These results do not necessarily suggest that human physiological response is the main contributor to these interregional variations. However, they do suggest that human behavioral response is variable on an interregional level. Considering that there already exists a proliferation of absolute indices, a relative index is justifiable for future evaluation in climate assessment research. This paper will attempt to show that a relative index can provide unique climatological information which may otherwise be unavailable and may have important assessment implications.
The WSI is designed to permit widespread application, and necessary input data are limited to those that are easily obtainable from all first-order weather stations. The index is easy to understand, which permits utilization by professionals who are interested in weather impacts but are not well versed in climatology. In addition, the WSI possesses the following advantages not found in the commonly-used "temperature-humidity index" (THI), "humiture," or "windchill index:"
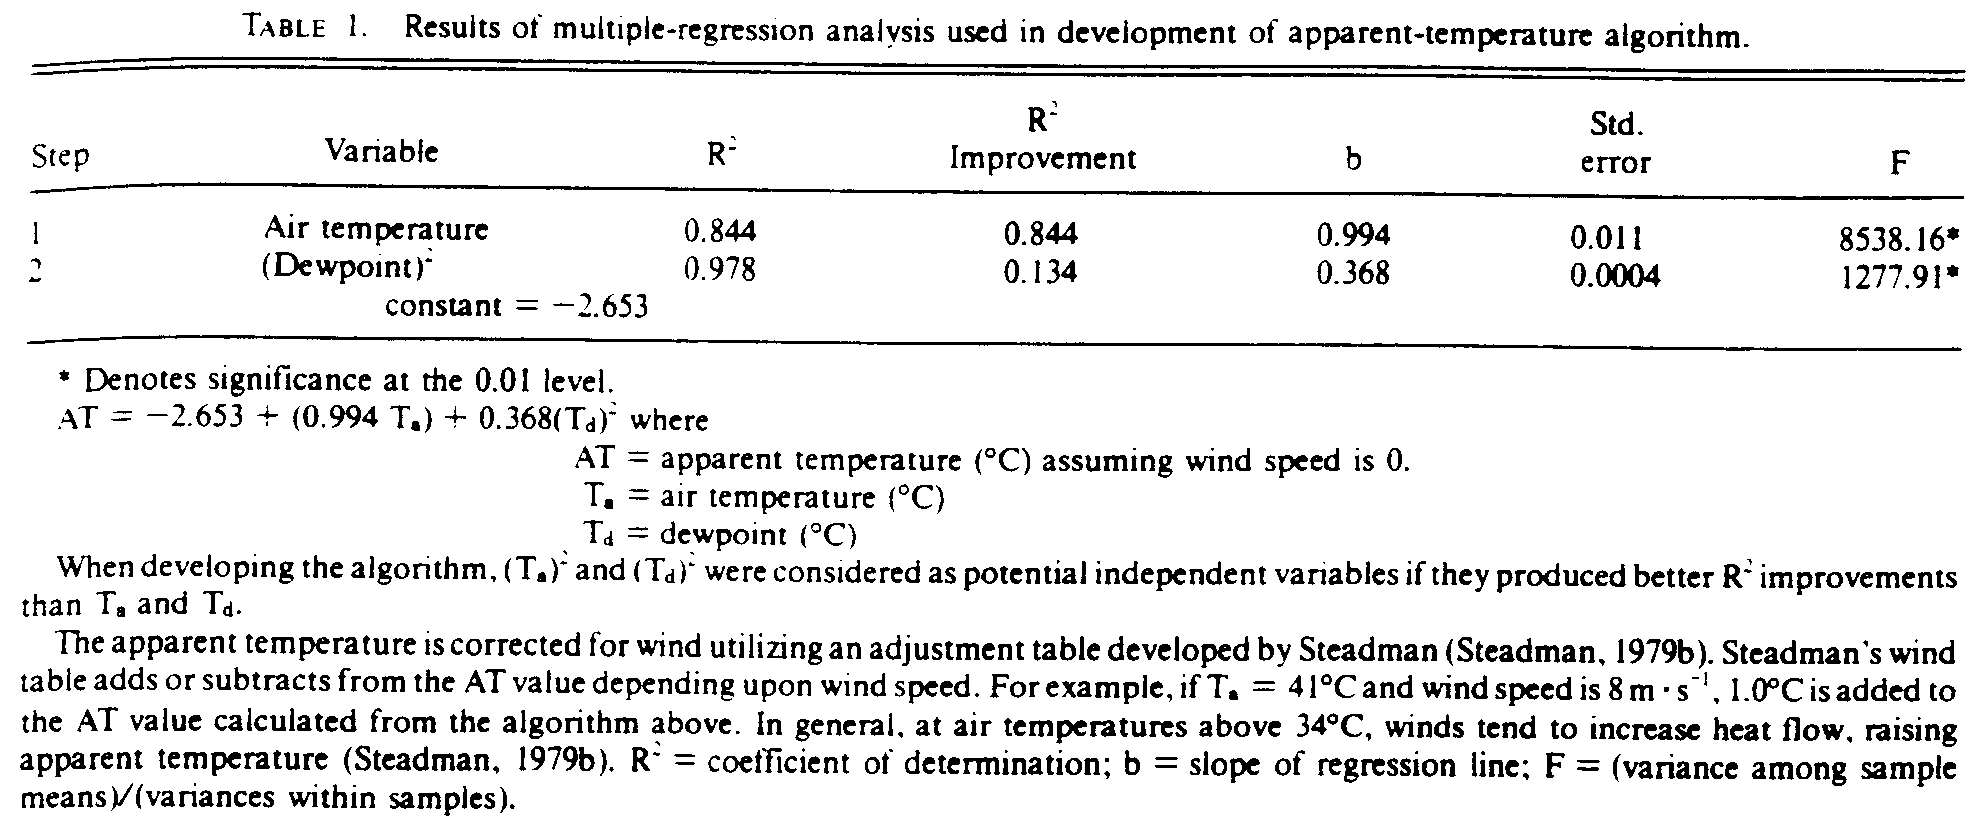
Utilizing the summer-season algorithm displayed in Table 1, 40 years of 0300 LST and 1500 LST daily apparent temperatures were computed for approximately 100 evenly spaced first-order weather stations around the country. The WSI was developed from this detailed data base.
The WSI is calculated by evaluating how the 0300 LST and 1500 LST apparent temperature varies from the mean apparent temperature for these hours on each day at that locale. If means and standard deviations were calculated at these hours for each day, the sample size would only be 40, creating random errors and undesirable day-to-day fluctuations. Thus, days were grouped into weekly units, and daily means and standard deviations for 0300 LST and 1500 LST were developed from a sample of 280 days (7 days X 40 years). For example, all days from 1 to 7 June at 0300 LST would possess the same mean apparent temperature and standard deviation. During the months of June, July, and August, any intraweekly variations in daily mean apparent temperature should be very slight, so this grouping procedure would result in minimal loss of information. However, increasing the sample size from 40 to 280 days would considerably diminish noise and unwanted fluctuations. In addition, the data were smoothed further by fitting the means and standard deviations to a cubic spline, which produces a rational function to approximate true trends in the means and standard deviations (International Mathematical and Statistical Libraries. Inc., 1982).
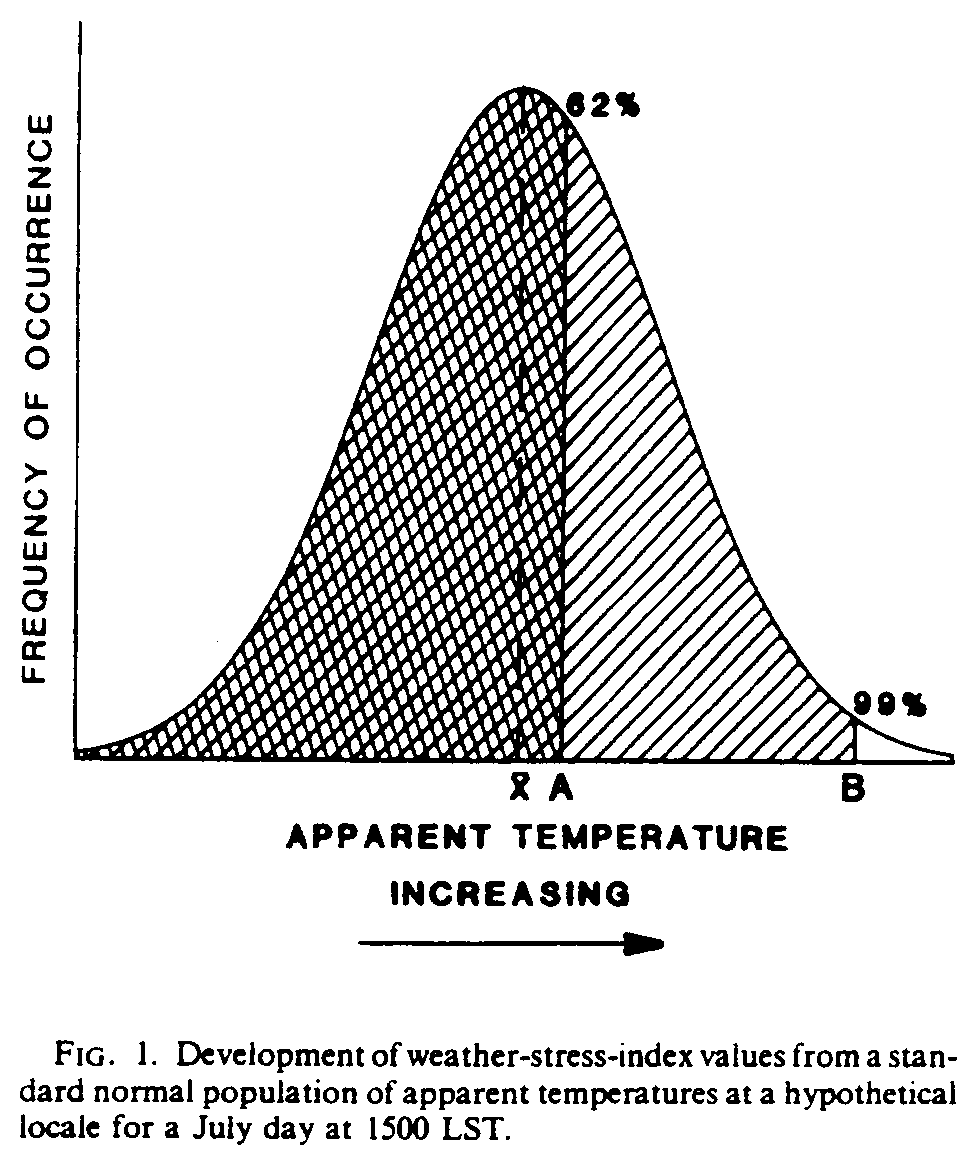
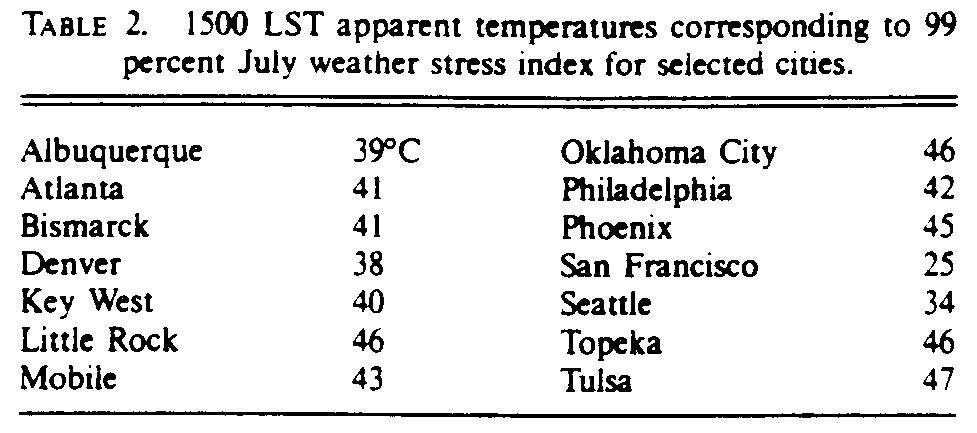
After completion of this procedure, any real-time apparent temperature is compared to the mean and standard deviation for that day and hour by transforming the normally distributed sample to a standard normal population utilizing a Z-transformation procedure (Fig. 1). In this example, for a daily apparent temperature of A on a particular summer day at a given locale, 62 percent of the days exhibit lower apparent temperatures. An apparent temperature of B is much more extreme, as 99 percent of the days exhibit lower apparent temperatures. Thus the WSI is defined as the proportion of days with apparent temperatures lower than the day under review. A WSI of 99 percent would probably prove to be quite stressful to the general population, as most people would be unaccustomed to these conditions. Of course, the apparent temperatures corresponding to a 99 percent weather stress index vary according to time-of-year and locale, as indicated in Table 2. However, the interregional impact of these various apparent temperatures at the 99 percent WSI level might be somewhat constant on a variety of socioeconomic parameters such as mortality, employee absenteeism, and recreation, since these conditions are similarly unusual in all of these places.
Maps and data bases were produced to evaluate the geographical distribution of WSI and apparent-temperature values for the United States during the summer season. Some of the results were unusual as they did not resemble the mean temperature maps found in the National Climatic Atlas of the United States (U.S. Department of Commerce, 1968). The WSI maps were unique as they represent the first time that a relative weather index has been mapped nationally.
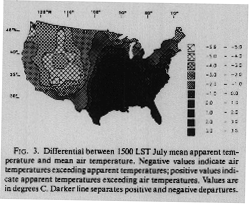
A map of mean apparent temperature for 1500 LST during the month of July shows a general latitudinal gradient that is to be expected (Fig. 2). The maps for June and August possess similar characteristics. The lowest mean apparent temperatures are found in the Pacific Northwest, coastal California, the Lake Superior region, and northern New England. The highest values are in the Desert Southwest and in portions of Texas and Oklahoma. Although this seems to approximate the mean temperature map for July, there are some noteworthy differences (Fig. 3). When evaluating the differential between 1500 LST mean apparent temperature and 1500 LST mean temperature, it is noteworthy that apparent temperatures are lower than air temperatures throughout most of the western and northern parts of the country but exceed air temperatures in the southern and southeastern sections. This is attributed to relatively high dewpoints found in the southern United States which contribute to the magnitude of the apparent-temperature value. The northerly extent of this differential in the central United States is due to higher mean wind speeds which increase apparent temperatures when it is very warm (U. S. Department of Commerce, 1968).
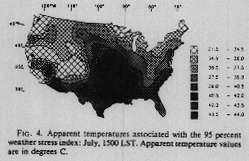
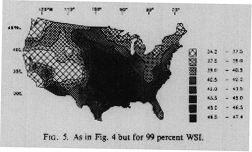
The WSI maps for July seem to indicate that the most sultry areas in the country are in somewhat unexpected locales (Figs. 4 and 5). The 95 percent WSI map shows the July apparent temperature at 1500 LST which is exceeded 5 percent of the time over the 4-year period of record throughout the country. In a large area of the central United States from southern Nebraska to Texas, the apparent temperature associated with the 95 percent WSI is greater than 42degC and exceeds 43.5degC in a small area of northern Oklahoma and southern Kansas. By contrast, the Desert Southwest did not experience apparent temperatures of this magnitude during the period of record. The 99 percent WSI map shows this phenomenon as well. A large area from Nebraska southward to Texas, Louisiana, and western Tennessee experiences the highest apparent temperatures during summer. Although southern Texas and parts of Arizona possess higher mean apparent temperatures, the WSI suggests that extremely high apparent temperatures are more common in the central United States.
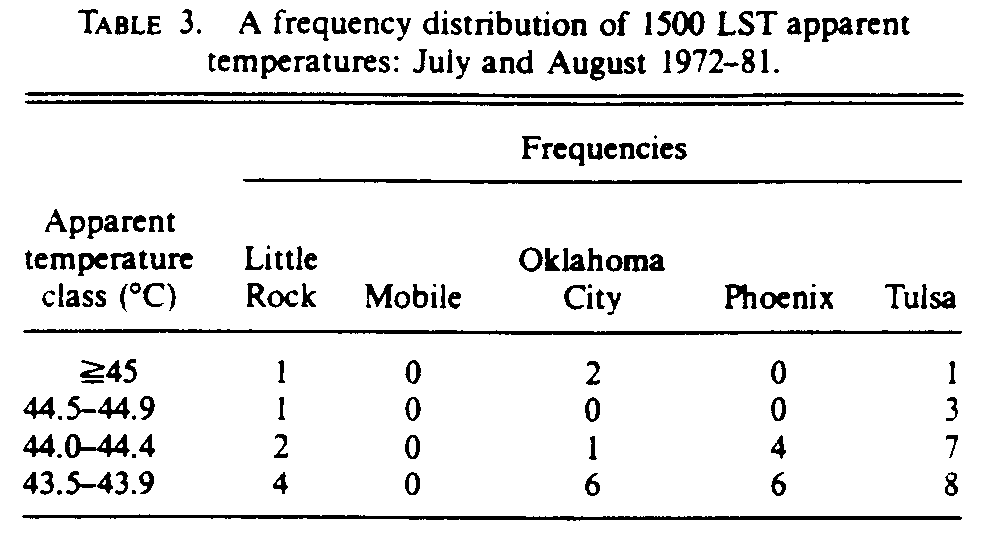
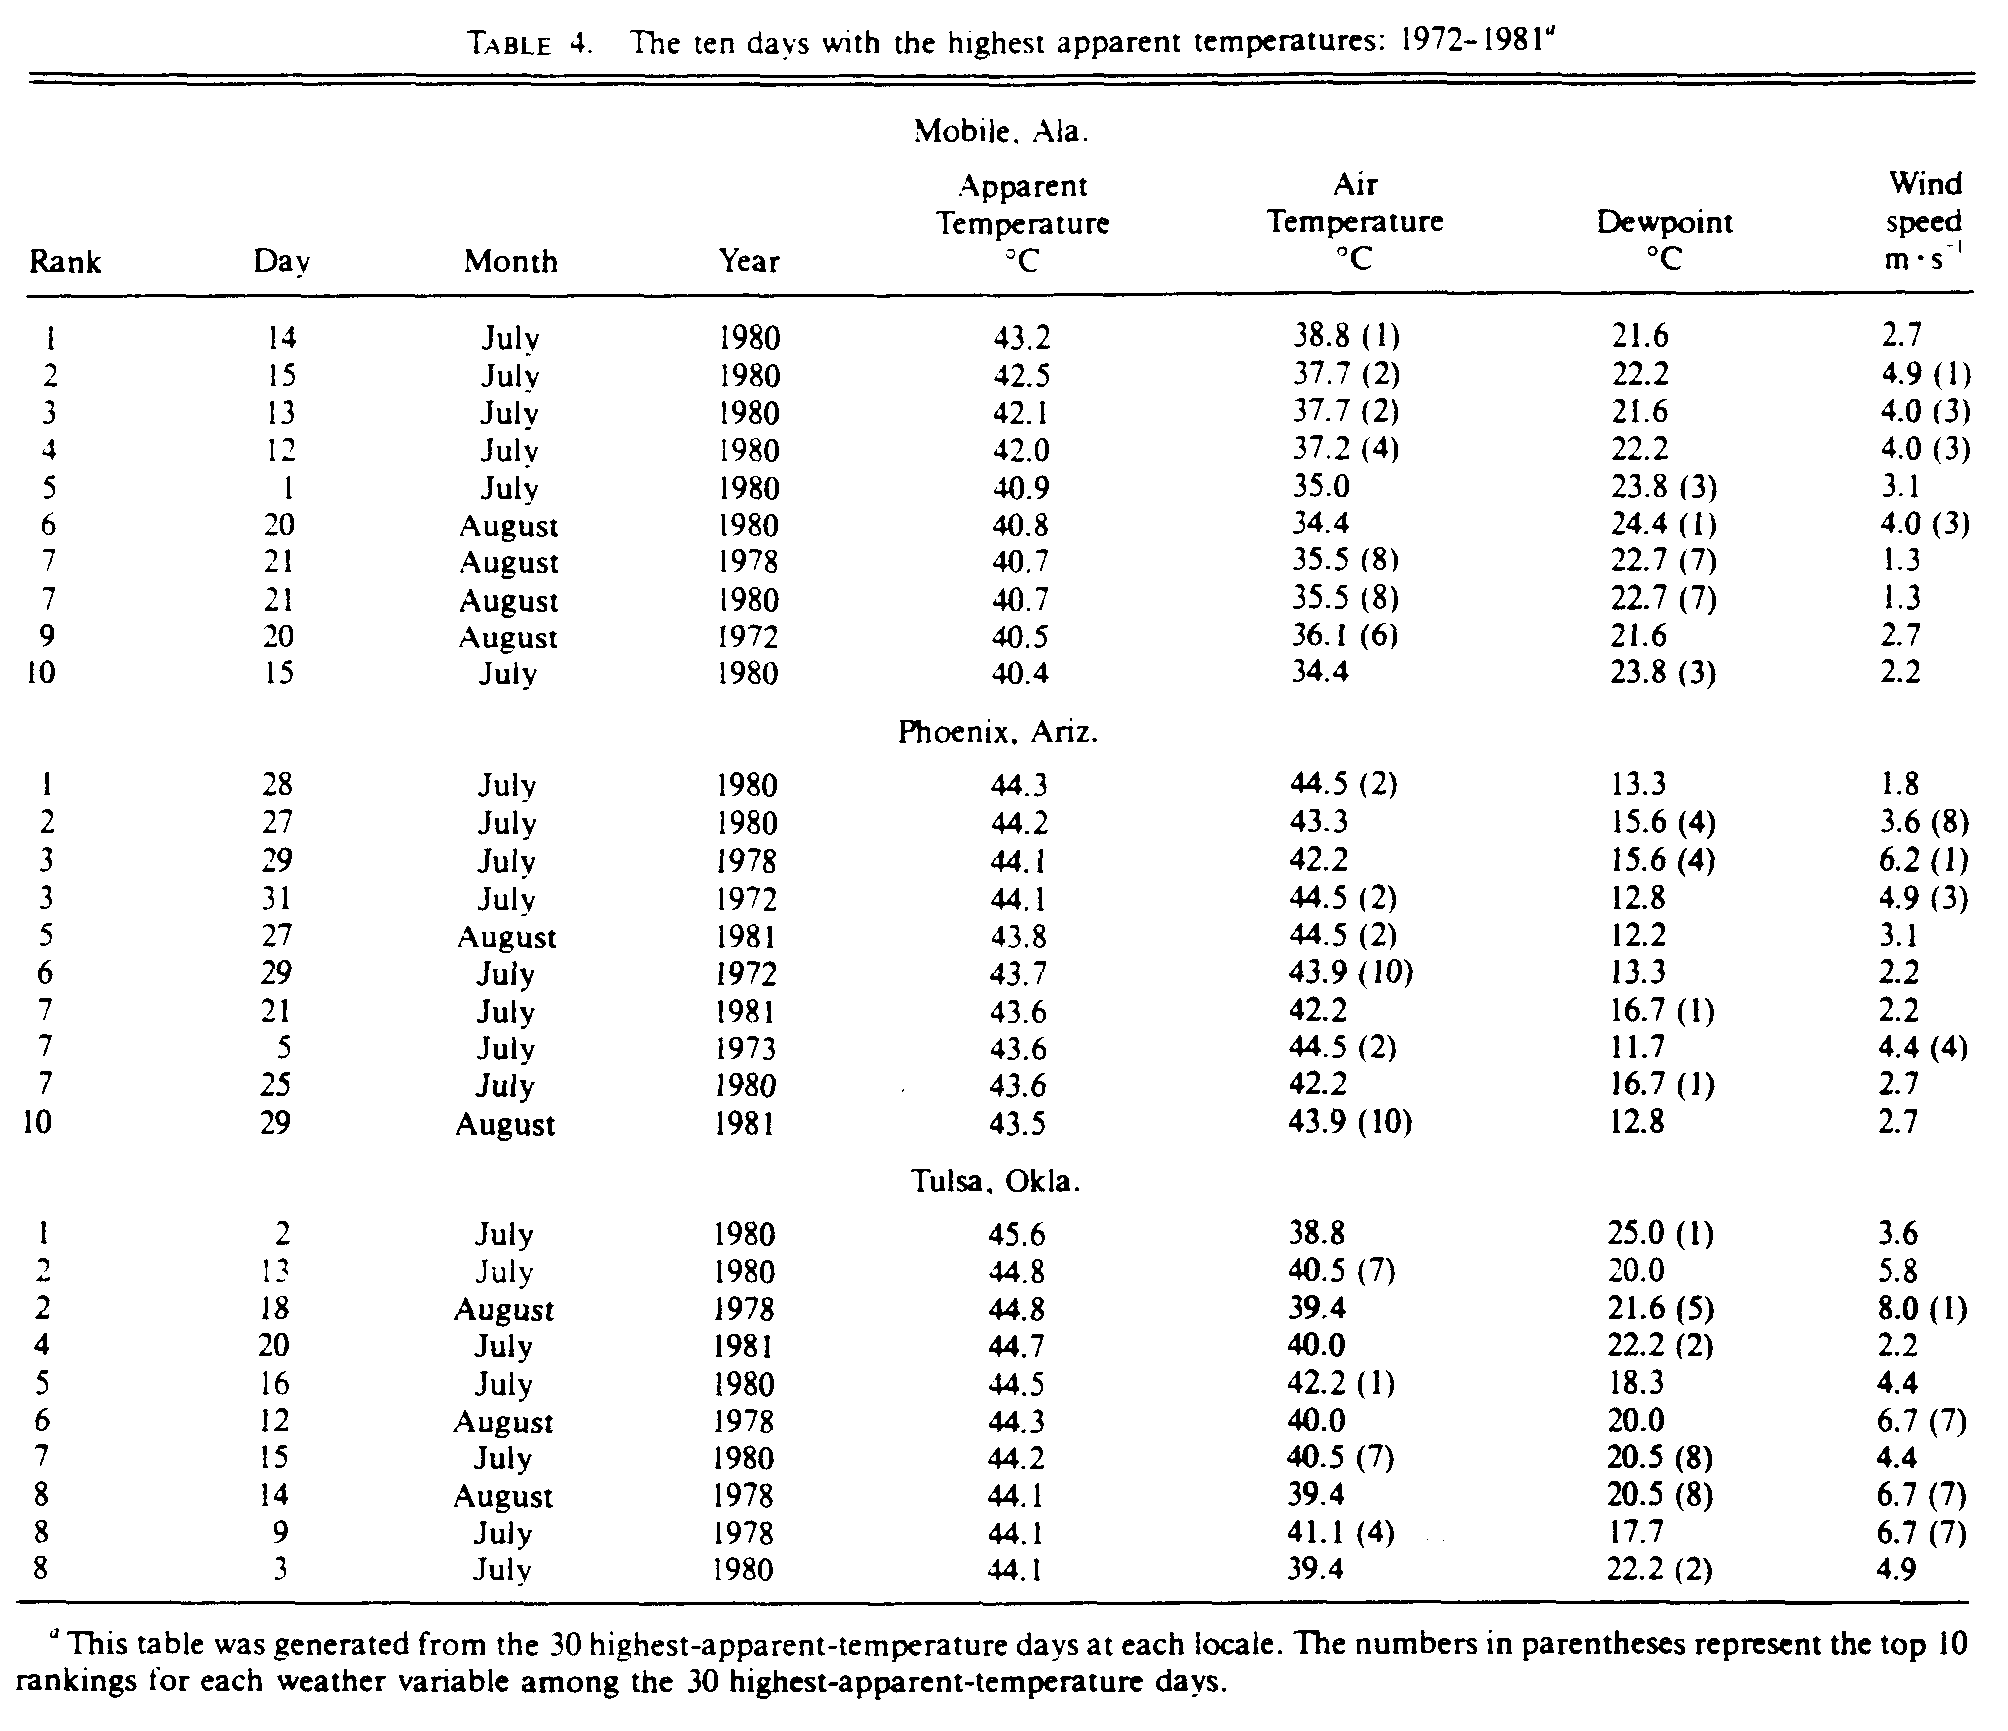
An evaluation of the frequencies of apparent-temperature classes indicates that the highest recorded values do, in fact, occur in the central United States (Table 3). Apparent temperatures exceeding 44degC occurred on 11 days in Tulsa over 10 summer seasons between 1972 and 1981. Four of those days had values over 44.5degC. In Phoenix, apparent temperatures over 44degC occurred on only four days over the same time period, and values never exceeded 44.5degC. Oklahoma City's values were not as high as Tulsa's, but three days did possess apparent temperatures that were higher than any in Phoenix over the time period. Even Little Rock's highest apparent temperatures were greater than those recorded at Phoenix. The lower apparent temperatures at Mobile indicate that the high-apparent-temperature phenomenon does not extend to the Gulf Coast.
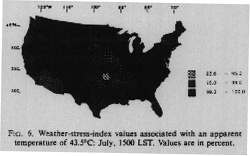
The WSI values associated with an apparent temperature of 43.5degC indicate that this temperature is at least as common in much of the central United States as in the Desert Southwest (Figure 6). From the Dakotas southward, an apparent temperature of 43.5degC occurs more frequently than once every 100 days in summer (weather stress index < 99 percent), and in a small area in northern Oklahoma and southern Kansas this apparent temperature is exceeded more frequently than once every 20 days (weather stress index < 95 percent).
What climatological factors contribute to these excessively high apparent temperatures in the central United States? It appears that the combination of high temperatures and dewpoints are a unique feature to this region and may provide an important clue. The 30 days with the highest apparent temperatures were isolated for Mobile, Phoenix, and Tulsa for the period 1972-81 to determine which weather variables were contributing to the magnitude of apparent temperature. Air temperatures, dewpoints, and wind speeds were ranked for the 30 days. and it appears that these variables exert a differential influence during very high temperature days in these three places. For example, the 10 highest-apparent-temperature days in Tulsa were not necessarily the hottest, as only four of these days ranked among the top 10 in air temperature (Table 4). In fact, over the period of record, the highest air temperature recorded in Tulsa, 42.2degC, occurred three times, but only one of those days is in the top 10 apparent-temperature group. The day with the highest apparent temperature in Tulsa, 2 July 1980, experienced a "relatively cool" air temperature of 38.8degC. In Phoenix, six of the 10 days with the highest apparent temperatures also were ranked among the 10 highest air temperatures. The day with the highest apparent temperature in Phoenix, 28 July 1980, experienced the second highest air temperature. In general, the most uncomfortable days in Phoenix were also the hottest, which was not the case in Tulsa.
A different pattern emerges when dewpoints are evaluated on the days with the 10 highest apparent temperatures in these cities. In Tulsa, six of the 10 highest-apparent-temperature days also ranked among the top eight days in dewpoints; this figure was only four in Phoenix. In general, the most uncomfortable days in Tulsa also exhibited the greatest atmospheric moisture content, which was not the case in Phoenix.
In an attempt to determine quantitatively which weather elements contributed to the magnitude of apparent temperature on the top 10 days, a stepwise multiple-regression analysis was performed with apparent temperature as the dependent variable and air temperature, dewpoint, and wind speed as independent variables. It appears that air temperature contributes most to variations in apparent temperature in Mobile and Phoenix, while dewpoint contributes most in Tulsa and Oklahoma City (Table 5). Little Rock seems to be influenced somewhat by both weather variables. Thus the magnitude of apparent temperature on the most uncomfortable days is primarily dictated by variations in thermal characteristics in the Desert Southwest and the humid Gulf Coast while variations in atmospheric moisture largely control the magnitude of apparent temperature in the central United States.
What is the explanation for these regional differences? Why are the highest apparent temperatures found in the central United States? It appears that the causal mechanisms are synoptic/air-mass based. In the Desert Southwest, the dominance of continental tropical air during the hottest periods assures that the dewpoint will rarely exceed 16degC when the air temperature tops 43degC (Table 4). Thus any increase in apparent temperature is dependent upon a concomitant increase in air temperature but not dewpoint. The synoptic character of the atmosphere during the hottest periods will not permit intrusions of moist air, which will only arrive when surface and 700-mb support induces a cloud cover and lower temperatures. This situation, commonly referred to as Arizona's "summer monsoon," occurs when the intensity of the North Pacific surface anticyclone weakens and the latitude of the axis of the Bermuda anticyclone at the 700-mb level moves northward (Carleton, 1985). This causes deterioration in normal subsidence strength, increases cloud cover, and permits more-moist air to intrude from the Gulf of California and the tropical Pacific. During the period of record, dewpoints were above 20degC only when afternoon temperatures did not exceed 38degC. Thus the highest apparent temperatures were never achieved during periods when more-humid air masses were present in Phoenix.
In Tulsa and Oklahoma City, both continental tropical and maritime tropical air masses can intrude, but the highest apparent temperatures occur when maritime influences are strongest. The highest air temperatures in these locales occur when the dewpoint is somewhat depressed; thus the hottest days generally do not possess the highest apparent temperatures. However, the top 10 apparent-temperature days all exhibited dewpoints between 17.7degC and 25degC, indicating the importance of atmospheric moisture influx to elevate the apparent temperature. Generally a strong 500-mb ridge is present on the highest-apparent-temperature days to provide the necessary subsidence to insure high temperatures. However, simultaneous surface flow is from the south or southeast to permit intrusion of maritime influences. If the upper-level ridge is present but surface flow is from the west or southwest, this permits intrusion of continental tropical air masses, and the dewpoint is not sufficiently high to elevate the apparent temperature to top-10 status. This explains why the highest apparent temperatures do not occur when air temperatures are at their highest. The simultaneous occurrence of high temperatures and high dewpoints never occurs in Phoenix, and apparent temperatures in the desert locales do not reach the levels achieved in the central United States. Wind speed also plays a role in elevating apparent temperatures in the Midwest. On the 10 highest-apparent-temperature days. the average wind speed was 5.33 m * s[-1] at Tulsa, 6.49m * s[-1] at Oklahoma City, and only 3.38m * s[-1] at Phoenix.
In Mobile, it appears that continental tropical air masses almost never intrude when apparent temperatures are at their highest. Although the magnitude of apparent temperature on the 10 highest days was largely controlled by air-temperature variations (which was also the case in Phoenix), dewpoints were always above 21degC, eliminating the possibility that drier air masses were responsible. Thus the days with the highest apparent temperatures were dominated by maritime tropical air masses which just happened to be hotter than normal. This situation also requires the presence of a 500-mb ridge, and trajectory analysis indicates that this synoptic characteristic does exist on the days with the highest apparent temperatures. However, Mobile's apparent temperatures never matched those in the central United States because the high specific heat of the consistently moist atmosphere prevented air temperatures from reaching the necessary levels.
The goal of this study was to describe a relative index which is useful in evaluating human discomfort and to apply the index on a national level to determine which regions possess the most extreme summer values. The weather stress index was created by computing variations from the normal apparent temperature, and was used to provide information about the magnitude and frequency of very high apparent temperatures around the country. Although the highest mean apparent temperatures in the summer are found in the Desert Southwest, the WSI revealed that more-extreme high values are found in the central United States. In addition, the WSI provided information about the frequency of these extremely high values. This information would be unobtainable using an absolute index alone. The synoptic situations which contribute to very high apparent temperature distributions were isolated and described.
Most of the present climate-assessment research neglects to utilize relative indices which can provide more analytical information than traditional raw data or absolute weather indices such as windchill, humiture, and the temperature humidity index. Indices such as the WSI could provide valuable input when evaluating fluctuations in human mortality, absenteeism, and recreation. Although debate exists as to whether absolute or relative conditions are more influential on human activity, it is essential to utilize relative indices in climate-assessment research to enhance interregional evaluation and facilitate the development of large-scale models for national analysis of numerous climate-impact relationships.
Acknowledgments. This research was partially supported by the National Oceanic and Atmospheric Administration under Grants 83DAC00009 and NA85AA H A1098. The authors are most grateful to Mr. John M. Grymes III for providing much of the technical support and to Dr. Franklin E. Gossette and Mr. David R. Legates for developing the cartographic package used here.
1 Center for Climatic Research, University of Delaware, Newark, DE 19716.
2 Department of Geography, University of Delaware, Newark. DE 19716.
Court. A., 1981: Windchill over 40 years. Preprint Volume of Extended Abstracts: Fifth Conference on Biometeorology. American Meteorological Society, Anaheim, CA, 82-85.
Ellis, F. P., 1972: Mortality from heat illness and heat-aggravated illness in the United States. Environ. Res., 5, 1-58.
International Mathematical and Statistical Libraries. Inc., 1982: The IMSL Library Volume 2, IMSL, Inc.. Houston. 422 pp.
Jones, T. S., A. P. Liang, E. M. Kilbourne, M. R. Griffin, P. A. Patriarca, S. G. Fite Wassilak, R. J. Mullan. R. F. Herrick, H. D. Donnell, K. Choi, and S. B. Thacker, 1982: Morbidity and mortality associated with the July 1980 heat wave in St. Louis and Kansas City, MO. J. Amer. Med. Assoc., 247, 3327-3331.
Kalkstein. L. S., 1982: The weather stress index. NOAA Technical Procedures Bulletin, 324, 1-16.
Kalkstein, L.S., 1983: The development of indices for climate/socioeconomic assessment: The "weather stress index" as an example. The Pennsylvania Geographer, 21, 7-17.
Kalkstein, L. S. and R. E. Davis, 1985: The impact of winter weather on human mortality for environmental impact assessment. Proceedings of the 7th Conference of Biometeorology and Aerobiology, Scottsdale, AZ, 21-24 May 1985. American Meteorological Society, Boston, MA, 334-336.
Kilbourne, E. M., K. Choi. T. S. Jones, S. B. Thacker, and the Field Investigation Team, 1982: Risk factors for heat stroke: a case-control study. J. Amer. Med. Assoc., 247, 3332-3336.
Lally, V. E., and B. F. Watson, 1960: Humiture revisited. Weatherwise, 13, 254-256.
Masterson, J., and F. A. Richardson, 1979: Humidex, A Method of Quantifying Human Discomfort Due to Excessive Heat and Humidity, Environment Canada, Downsview, Ontario, 45 pp.
Quayle, R. and F. Doehring, 1981: Heat stress: A comparison of indices. Weatherwise, 34, 120-124.
Rotton. J., 1983: Angry, sad. happy? Blame the weather. U S. News and World Report, 95, 52-53.
Siple, P. A., 1945: General principles governing selection of clothing for cold climates. Proc. Amer. Philos. Soc., 89, 200-234.
Steadman, R. G.. 1971: Indices of windchill of clothed persons. J. Appl. Meteor., 10, 674-683.
Steadman, R. G., 1979a: The assessment of sultriness: Part I: A temperature-humidity index based on human physiology and clothing science. J. Appl. Meteor., 18, 861-873.
Steadman, R. G., 1979b: The assessment of sultriness: Part II: Effect of wind, extra radiation. and barometric pressure on apparent temperature. J. Appl. Meteor., 18, 874-884.
Steadman, R. G., 1984: A universal scale of apparent temperature. J. Climate Appl. Meteor., 23, 1674-1687.
Tan. G., and R. E. Davis. 1986: The relationship between winter weather and worker absenteeism. Publications in Climatology, (in press.)
Thom. E. C., 1959: The discomfort index. Weatherwise, 12, 57-60.
U.S. Department of Commerce, 1968: Climatic Atlas of the United States, U.S. Government Printing Office. Washington, D.C., 80 pp.
U.S. Department of Commerce, 1983: Impact assessment of weather stress: July 1983. Climate Impact Assessment, United States: July, 11-14.
Weiss, M. H., 1983: Quantifying summer discomfort. Bull. Amer. Meteor. Soc., 64, 654-655.
Winterling, G. A., 1979: Humiture--Revised and adapted for the summer season in Jacksonville, Fla. Bull. Amer. Meteor. Soc., 60, 329-330.