 Reproduced, with permission, from:
Saas, R. L., F. M. Fisher, Y. B. Wang, F. T. Turner, and M. F. Jund. 1992. Methane emission from rice fields: The effect of floodwater management. Global Biogeochemical Cycles 6 (3): 249-262.
Reproduced, with permission, from:
Saas, R. L., F. M. Fisher, Y. B. Wang, F. T. Turner, and M. F. Jund. 1992. Methane emission from rice fields: The effect of floodwater management. Global Biogeochemical Cycles 6 (3): 249-262.
THE EFFECT OF FLOODWATER MANAGEMENT
R. L. Sass, F. M. Fisher, and Y. B. Wang
Department of Ecology and Evolutionary Biology Rice University, Houston, Texas F. T. Turner and M. F. Jund
Texas Agricultural Experiment Station, Texas A&M University Beaumont
Increasing world population may cause an expected 50% increase in rice demand by 2020 [International Rice Research Institute, 1989]. In concert with a decreasing availability of cultivatable land, the anticipated increased world demand for rice dictates an intensification of current cultivation practices, which may result in increases in methane production.
Lowland or flood irrigated rice cultivation constitutes an important source of methane emissions, with a global annual emission rate of 100 +/- 50 Tg CH4 y-l [Schutz et al., 1989b](Tg=1012 g). Atmospheric methane concentrations had been increasing at a rate of 1% annually since 1978 to 1990 [Bouwman, 1990] and at a somewhat lower rate (0.8%) recently.
Methane is produced in flooded soils by anaerobic bacteria. Removing floodwater decreases methane emission to the atmosphere because soil aeration inhibits methane production by methanogens while concomitantly depleting existing soil methane through aerobic oxidation of methane by methanotrophs. We have shown that sudden loss of floodwater, due to storm damaged levees, quickly and dramatically reduces methane emission [Sass et al., 1990]. Although the field was reflooded the following day, methane emission did not recover until approximately 2 weeks after the floodwater loss.
Floodwater drainage is common in Japan to aerate the soil during midseason and to prevent Akiochi, a disorder in Japanese rice attributed to hydrogen sulfide toxicity due to low soil reduction potential and lack of oxygen in the root zone. During midseason drain and also during intermittent irrigation near the end of the growing season, a reduction in methane emission was observed in Japan [Yagi and Minami, 1990]. Whether the effect of draining on methane emission is through increased methane oxidation or decreased methane production is not known. In addition, no systematic study has been conducted to determine an optimum management practice to maintain a high yield of rice grain while reducing methane emissions to a minimum. Recognizing that the ideal treatment may depend on local conditions of climate, soil, and other management practices, we are conducting a series of experiments in Texas rice fields to address this problem. This paper describes a systematic study of the effects of four experimental floodwater management regimes on methane production and emission.
2.1. Field Description and Water Management
Field measurements were performed in rice fields at the Texas A&M University Agricultural Research and Extension Center near Beaumont, Texas, located at longitude 94deg.30'W, latitude 29deg.57'N. Annual rainfall averages 1340 mm, approximately 50% (122 mm month-l) occurring during the rice-growing season in April through September.
The soil used for this field experiment was a Verland silty-clay loam, classified as a fine montmorillonitic, thermic Vertic Ochraqualf. Typical of productive rice soils throughout the world, it has very little slope, poor internal drainage, and other physical-chemical properties that promote water containment and rice growth. This soil is locally designated as Bernard-Morey and has a clay:sand:silt ratio of 24:30:46. The area used in this experiment had not been cropped the previous year. Conventional rice levee equipment was used to construct 1.25-m-wide and 0.3-m-high earthen levees around four 400-m2 plots.
The rice cultivar "Jasmine 85" chosen for this experiment is similar to the high tillering and high yielding rice grown throughout the world. Jasmine 85, developed at the International Rice Research Institute, Los Baños, Philippines, requires approximately 140 days to mature under normal planting dates in the southern United States. The rice was drill-planted at 112 kg ha-1 in rows spaced 20 cm apart on May 2, 1991. Seedling density ranged from 250 to 300 m-2. Nitrogen as urea was applied in three treatments: 75 kg N ha-1 on May 31 (17 days before permanent floodwater), 50 kg N ha-l on June 19 (2 days after permanent floodwater on all fields except the late flood), and 40 kg N ha-l on July 11 (3 days after panicle differentiation).
The most common rice irrigation practices in the southern United States consist of periodic brief flush irrigations after planting to maintain adequate soil moisture until rice plants reach approximately 15 cm in height (20-40 days after seedling emergence) and thereafter a 10-cm flood maintained until 10 to 14 days prior to harvest. To test water management effects on methane emission, four different floodwater management programs were imposed. In the control plot, normal flooding practices for this region were followed, i.e., permanent flooding (10 cm) 7 weeks after planting and continuing for 81 days. Three other flooding programs were investigated; midseason drainage aeration, multiple drainage aeration, and late season flood. The midseason aeration plot was flooded over the same time period as the normal or control plot except for a 6-day drained period 31 days after establishing the normal flood or approximately 3 weeks before heading. The multipleaeration flooding regime also covered the same time period as the control plot except for three intermittent drained periods of 2 to 3 days duration. These occurred approximately 3, 6, and 9 weeks after initial flooding. The late flood was planned to provide floodwater during the critical period of panicle differentiation and flowering. Permanent floodwater was actually applied 76 days after planting, and the field was drained 145 days after planting prior to harvest. Normally, this period is from 75 to 105 days after planting and is considered to be the shortest permanent flooding period consistent with normal grain yields. The irrigation programs used in this study are diagrammed in Figures 2a through 2d.
We did not measure N20 emissions. However, floodwater draining may directly influence fertilizer nitrogen use efficiency and could cause a pulse of nitrification to occur, leading to a pulse of released N20, a potent greenhouse gas. To minimize these effects, all nitrogen applications in all of the water treatments were performed before permanent flooding or at least a week before or immediately after scheduled field drains.
2.2. Field Methane Measurements
Two aluminum flux collars, affixed with airtight side panels with removable plugs for water movement, were permanently installed in each experimental field near the end of boardwalks to prevent soil disturbance and ensure reproducible placement of gas collecting chambers during successive methane emission measurements. Each methane flux determination was made by taking samples of the headspace gas in an open-bottom chamber temporarily placed on the flux collar. Chambers had a cross-sectional area of 0.397 m2 and volumes of from 0.119 to 0.476 m3. Boxes of different heights were used at different times during the season (depending on height of the rice plants). The chamber was placed over the vegetation for 30 min with the bottom edge of the chamber below the water surface and fitted into a groove in the permanently installed collar. During drained periods, an airtight seal around the chamber was obtained by filling the groove in the flux collar with water. The chamber was shaded with a l-cm foam insulation on its top to minimize temperature changes during measurements. Larger chambers were fitted with a circulating fan to ensure complete gas mixing.
Methane concentrations were determined with a gas chromatograph fitted with a flame ionization detector (FID/GC). Methane emission was determined from the rate of change of concentration in a set of five samples (50 cm3) taken over a 30-min sampling period. Sample sets of methane concentration versus time which did not yield a linear regression value of r2 greater than 0.90 were rejected. Of the three flux measurements rejected by this criterion, all were traced to leaking stopcocks. In no case was there an indication of ebullition during flux measurements.
Dissolved methane in soil pore water was determined by sampling a series of depths with a Plexiglas close-interval dialysis sampler similar to that described by Hesslein [1976]. The sampler was placed into the sediment for an equilibration period of a minimum of 1 week. Upon retrieval, water samples were quickly withdrawn through the membrane via a hypodermic needle into disposable 10-cm3 glass syringes fitted with gastight stopcocks. Methane-free nitrogen was introduced into the syringe, dissolved gases were stripped by vigorous shaking for 2 min, and the methane in the headspace is measured [McAliffe, 1971] by FID/GC.
2.3. Climate and Other Field Measurements
Water depth, flux chamber air temperature, and water temperature were recorded with each set of emission measurements. Field water additions were recorded continuously throughout the study. Minimum and maximum daily temperatures of soil and water (2 cm below soil surface and 2 cm above soil surface, respectively) were continuously monitored in the fields. Daily air maximum and minimum temperature, daily precipitation and evaporation were recorded by the weather station located at the Texas A&M University Agricultural Research and Extension Center, approximately 800 m from our experimental fields.
2.4. Methane Production From Soil Incubations
Triplicate soil cores were obtained from each plot at 1- or 2-week intervals starting approximately l week after normal permanent flooding. Cores were divided, and methane production values were determined at four different depth intervals: 0-2.5 cm, 2.5-5 cm, 5-7.5 cm, and 7.5-10 cm.
Soil cores were taken with coring devices made from 60-cm3 plastic syringes from which the needle end had been removed and the wall sharpened. The corer was turned into the soil until it was filled, capped with a rubber stopper, and removed from the ground. Cores were subdivided into 2.5-cm depth increments and immediately introduced into an intact 60-cm3 plastic syringe equipped with a stopcock. An approximately equal quantity of field water was added to give a total volume of 30 cm3, and all air was purged. These were then returned to the laboratory in less than 4 hours, whereupon 30 cm3 of methane-free nitrogen was added. The dissolved gases were stripped by vigorous shaking for 2 min, the gases purged, the syringe refilled with nitrogen gas and incubated at 28deg.C. Headspace gas samples were taken at 24-hour intervals for 3 days and analyzed for methane. After each methane determination, all gases were removed and 30 cm3 of methane-free nitrogen was introduced to the syringes. Methane production rates were calculated by averaging the three daily rates of the triplicate samples.
Methane production values from core segments at all four depths were summed together to give the total methane production per unit core area. During previous studies it was found that less than 5% of the total produced methane originated in soils below 10 cm of depth [Sass et al., l99O]. From the known cross section of core samples, field methane production values per square meter were estimated. Methane oxidation was calculated by subtracting methane emission values from methane production estimates.
2.5. Plant Biomass Measurements
Rice plant height was measured at each field site during each methane emission measurement. Aboveground biomass was recorded several times during the season. For determination of aboveground biomass, plants from 0.5 x 0.5 m quadrats near the flux collars were clipped at ground level at 14-21 day intervals, and the samples were dried to constant weight at 70deg.C. Net aboveground primary production was estimated as the sum of the differences in biomass between sample intervals at each sampling station.
Rice grain yield was obtained by hand harvesting duplicate 0.5 m x 0.5 m quadrats and separating the grain. The resulting rough grain was weighed, forced-air dried at 38deg.C to constant weight, and reweighed. Grain yield is reported as rough rice grain corrected to 12% moisture content.
3.1. Seasonal Variation in Daily Methane Emission
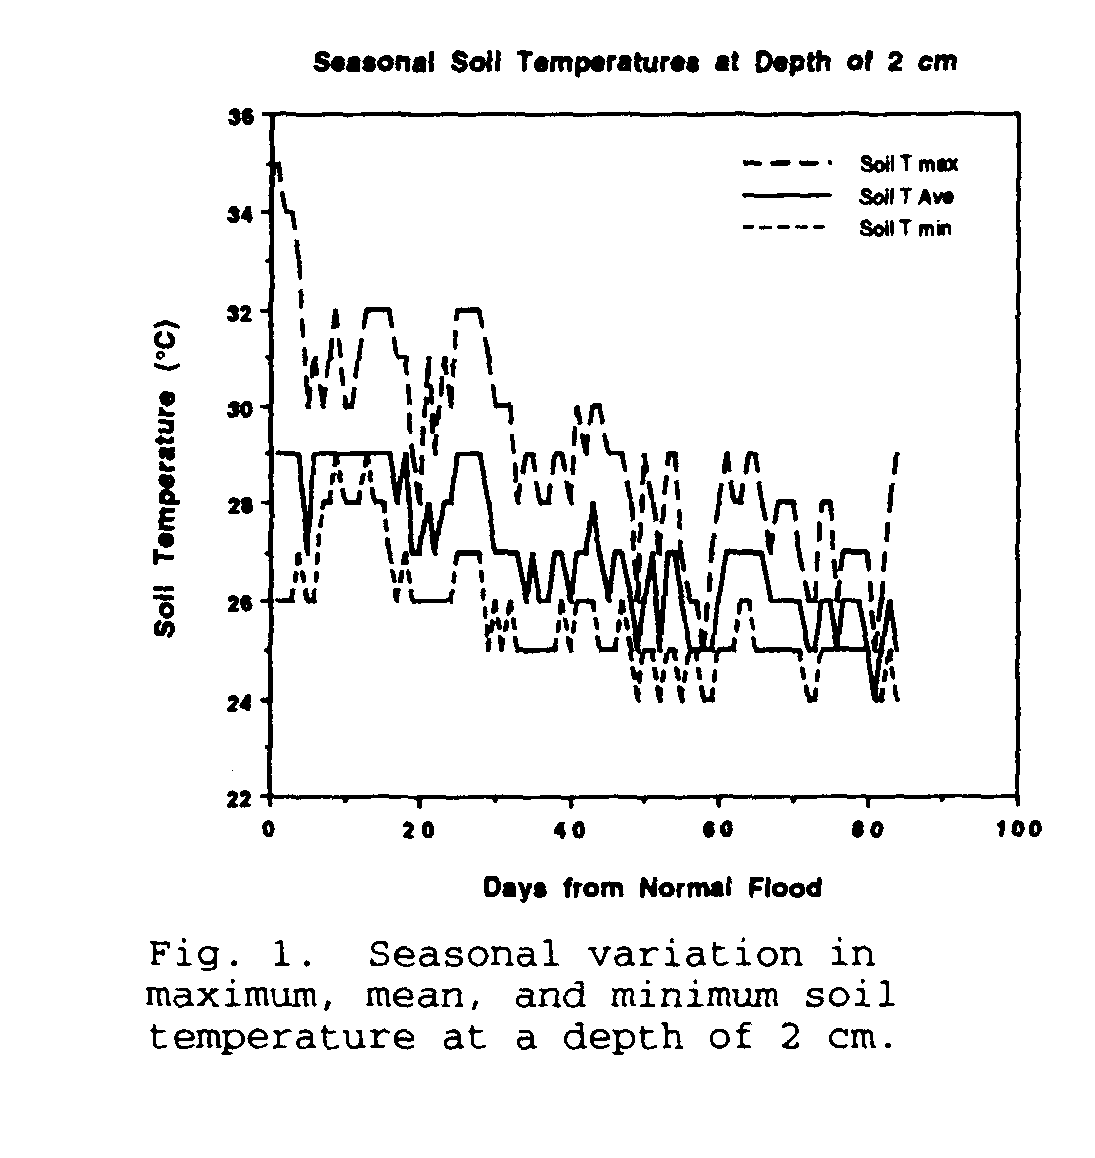
Duplicate methane emission rates were measured twice weekly in both control (normal flood) and experimental water management fields. To establish diel variations of methane emission, flux measurements were taken at 3-hour intervals over a 24-hour period several times throughout the season. The measurement period extended from the time of permanent normal flooding until field draining. No significant methane emission (< 0.5 mg m-2 d-l) was observed in any field before flooding or after field draining. Observed emission rates were converted to daily rates by correcting for methane emission changes due to diel temperature variations [Sass et al., l991b]. Daily soil temperatures during the period of methane emission measurements are shown in Figure 1.
Methane emission rates (average of two sites) are shown in Figure 2a (normal flood), Figure 2b (midseason aeration), Figure 2c (multiple-aeration), and Figure 2d (late flood). Draining and flooding events are represented in these figures by vertical dotted lines. A shaded bar shows during periods when the fields were flooded.
In all fields, methane emission did not reach significant levels (> 1.0 mg m-2 d-l) until at least 1 week after flooding. The three fields with normal initial flooding showed essentially the same time course of increasing methane emission either until a scheduled draining event or just prior to panicle differentiation.
The seasonal course of methane emission from the normal flooded field (Figure 2a) was similar to that found in other studies [Sass et al., 1990, l991a, b]. In the midseason aeration treatment (Figure 2b), methane emissions dropped after draining to very low values for approximately 2 weeks but rose again near the end of the season to levels comparable to those observed in the normal flood control field. In the multiple-aeration water treatment (Figure 2c), the first drain occurred somewhat earlier than that in the midseason aeration field and coincided with the first methane emission peak observed in both fields. Methane emission was reduced by the first drain and remained very low during the remainder of the season because of two additional drains, separated by approximately 2 weeks. Methane emission from the late flooded field (Figure 2d) showed the same initial time course observed in the other fields but at a later phase in plant development. Emissions eventually increased to a much higher daily emission value than the other fields, leading to the highest methane emission rates observed in the study.
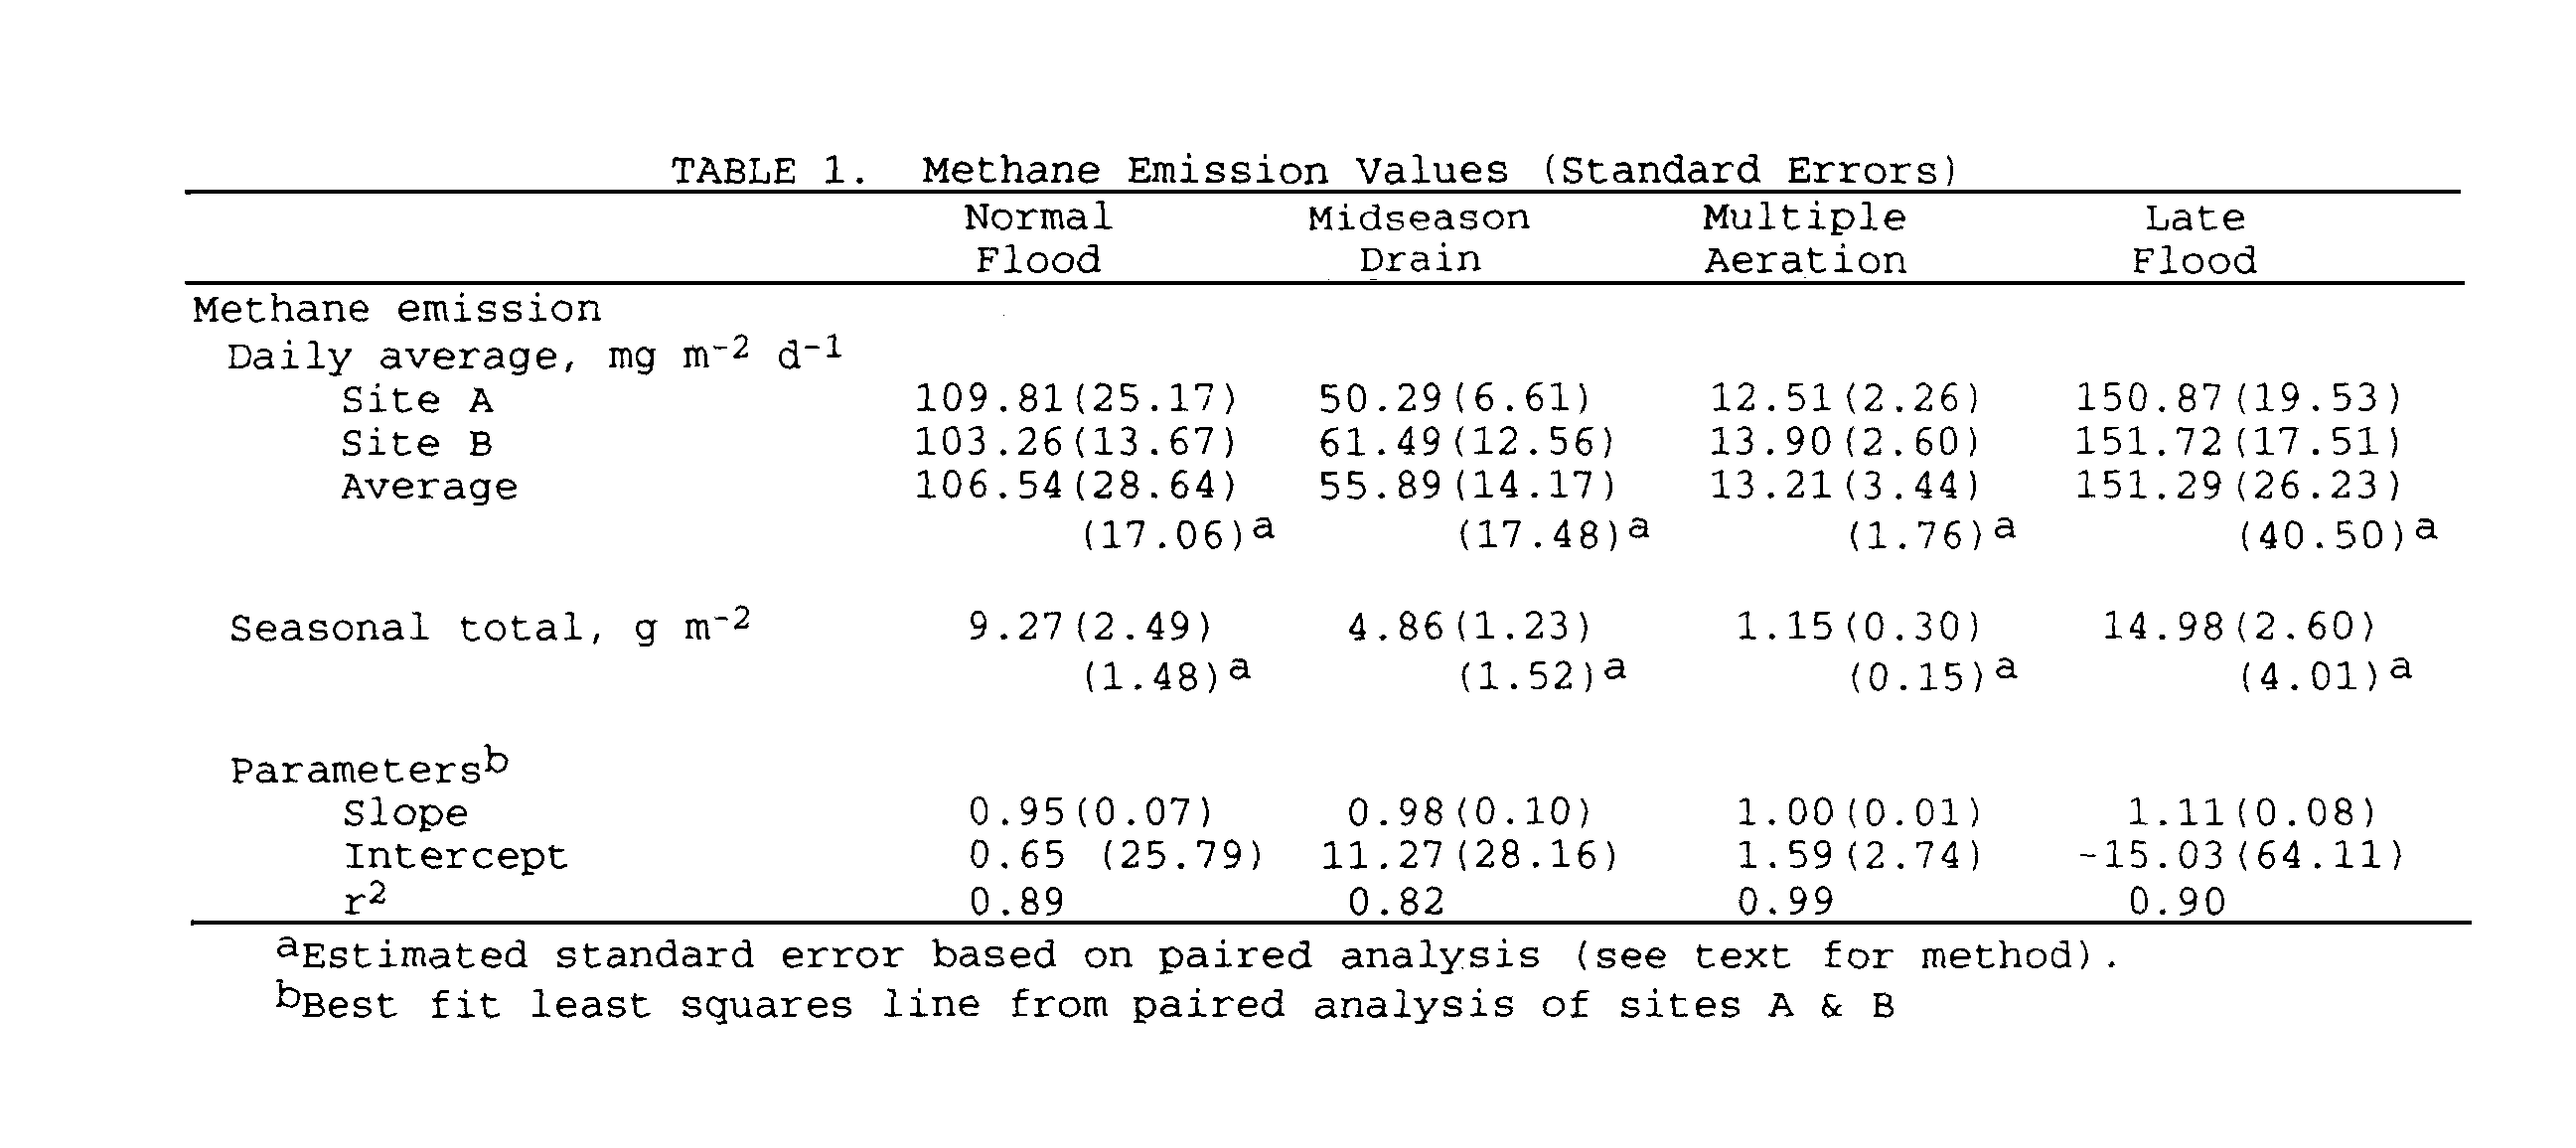
Values of methane emission rates are shown in Table 1. Average daily emission values are given for each site (A and B) of each treatment and for their mean. Complete sets of daily emission values for the entire season were obtained for each site of each treatment by linear interpolation of the twice weekly observed values. The average daily methane emission values quoted were obtained from these sets. The standard errors quoted were obtained from error estimates based on a least squares treatment of individual emission measurements.
Seasonal emission values shown in Table 1 were obtained by averaging the sum of the daily emission rates from both sites of each treatment. The standard error quoted was calculated based on the estimated standard errors of the individual daily emission measurements. In all treatments, the daily average emission from the two sites matched well within the 95% confidence level.
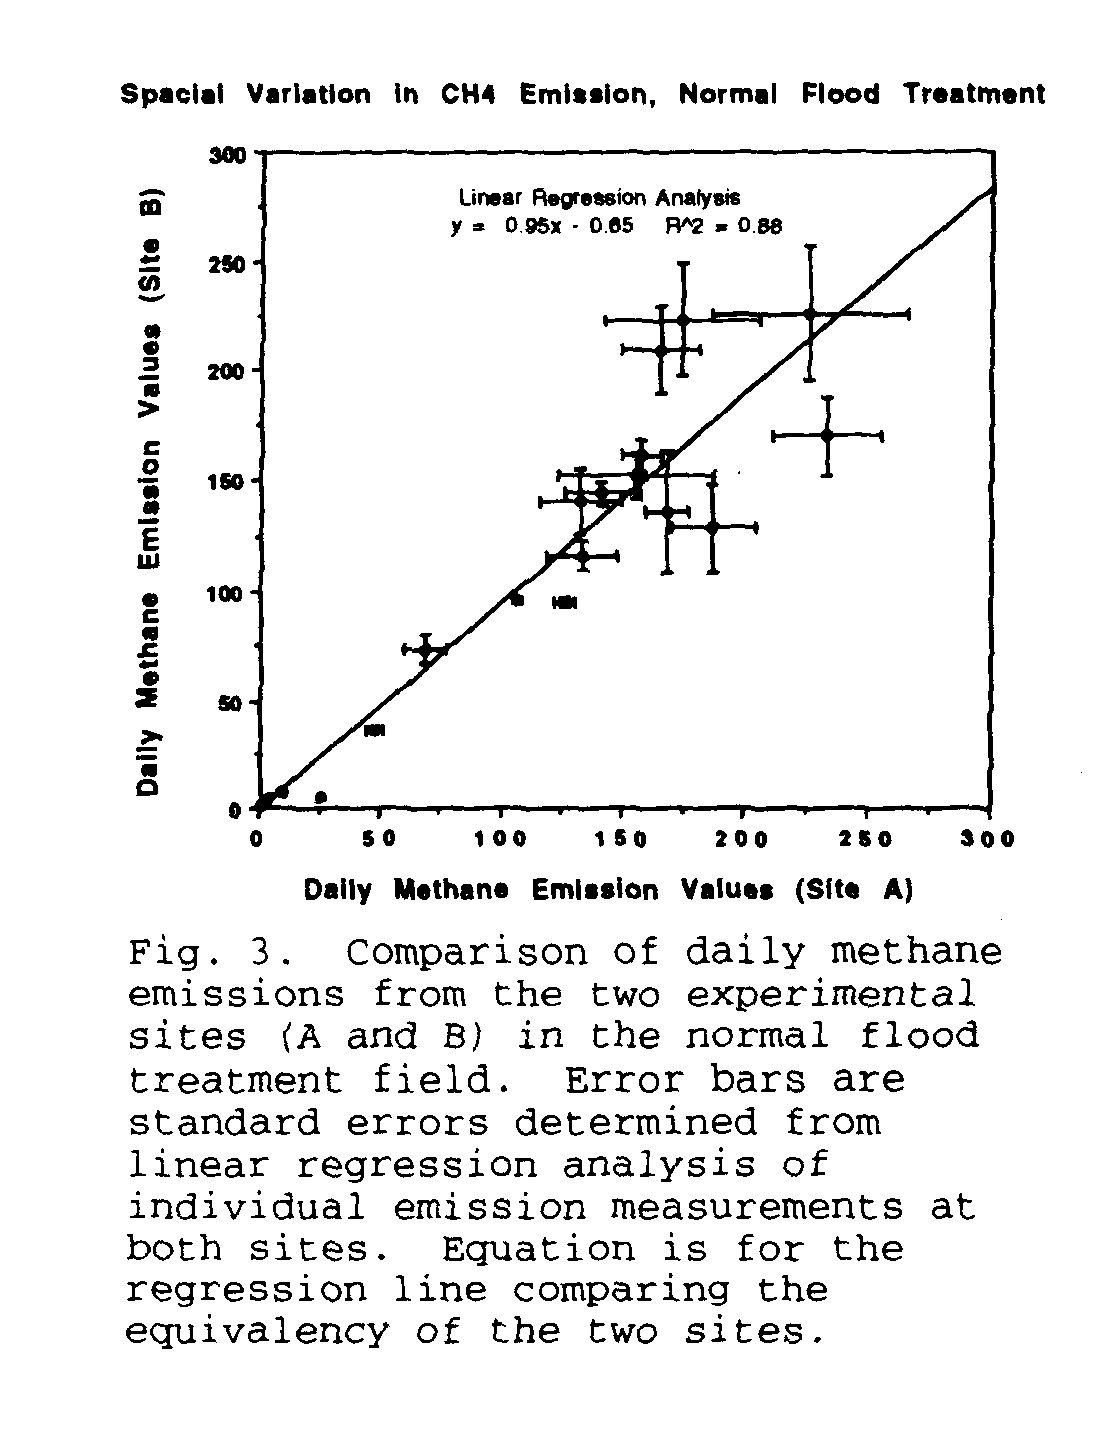
Methane emission within a single treatment field may show both spatial and temporal variations. Time-dependent site differences may not be evident in a comparison of average emission rates. To test for a time dependence in the spatial variation between daily methane emission from the two sites in each field, emission measurements from sites A and B for each day were paired. If no spatial variation is present at any time during the season, a graph of these pairs should show all points lying on a line through the origin with a slope of one. The graphical presentation of the data for the normal flood treatment is shown in Figure 3. The best fit least squares line shows a slope of 0.95 +/- 0.07 and an intercept of 0.65 +/- 25.7 (r2=0.88). These linear regression parameters for all treatments are given in Table 1. Strong spatial correlation is shown in all treatments. Furthermore, in all treatments, the two sites are equivalent within the error estimates of the analyses. Paired analysis can also yield a standard error of the mean. Generally, this error is expressed for the dependent variable. In our case, the two variables should be treated as equivalent. To accomplish this, a regression line assumed to be the exact correlation line passing through the origin with a slope of one was used. The error in the actual data points was assessed from the scale of the perpendicular to each point from this line. This treatment gives essentially the standard error of the mean difference between the two measurements and is presented for both the average daily and seasonal total methane emission in Table 1. These estimates of error are comparable with the quoted standard error based on individual emission measurements.
Finally, seasonal sets of average daily methane emissions from each treatment were tested against one another by paired analysis. In no case did a correlation coefficient (r2) greater than 0.20 result, and the hypothesis that any two treatments gave the same seasonal methane emission could be rejected at the 95% confidence level.
3.2. Methane Production From Soils
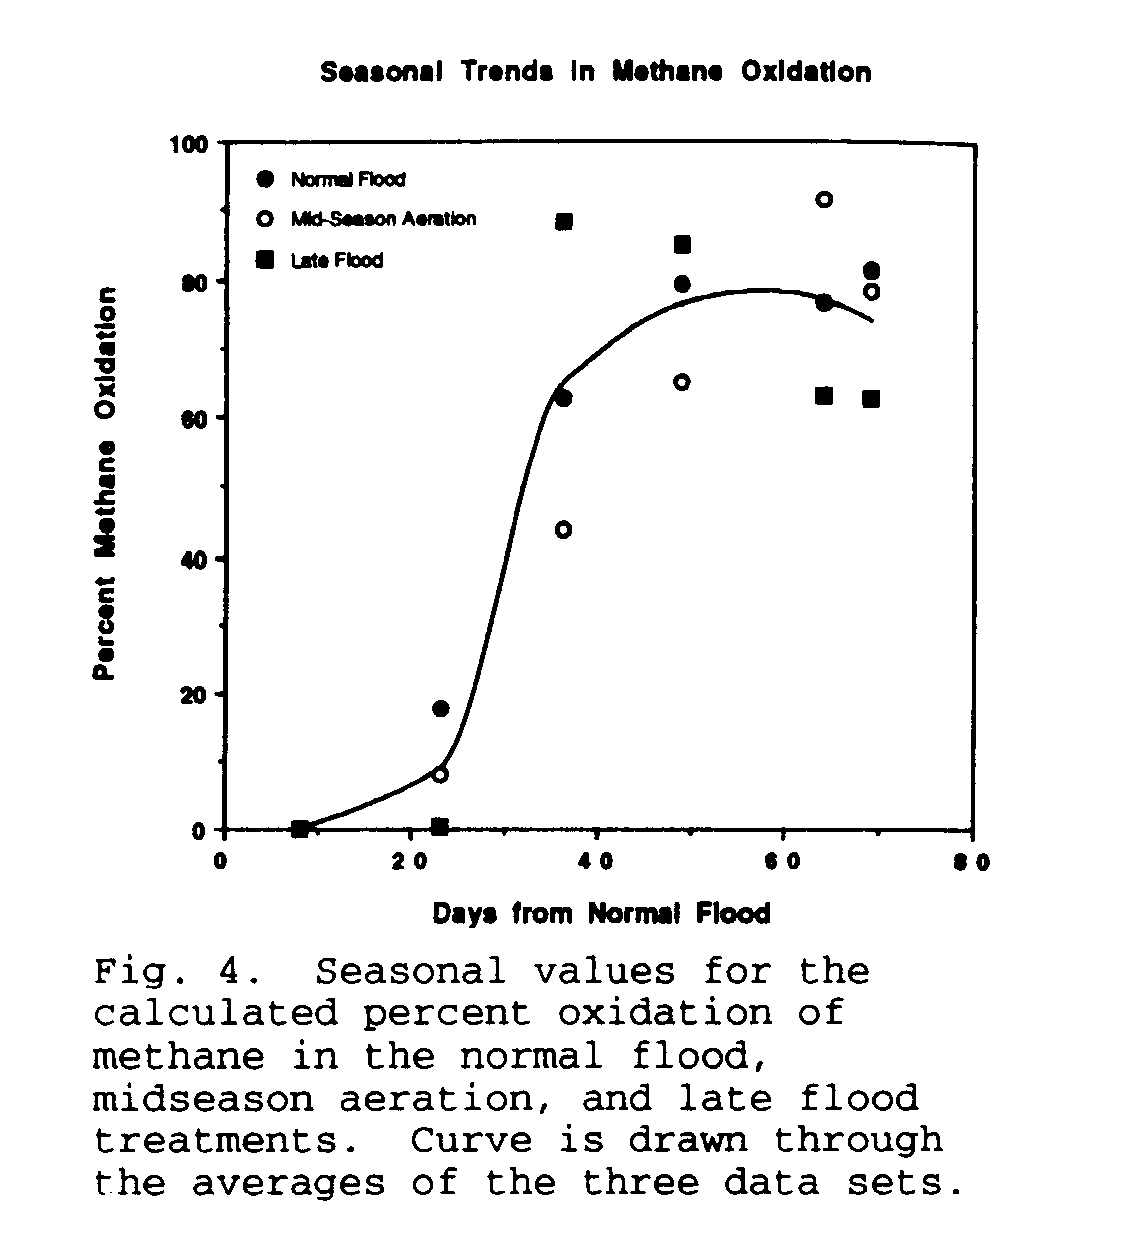
Six times throughout the season, soil cores were collected from all experimental fields and incubated to measure methane production. Methane production values were estimated as a function of time and soil depth. Between 80 and 90 percent of methane production was found in the upper 5 cm of soil and between 35 and 68 percent in the top 2.5 cm of soil. Total production estimates are shown in Figure 2a (normal flood), Figure 2b (midseason aeration), Figure 2c (multiple-aeration), and Figure 2d (late flood) for comparison with emission rates. Methane emission to production ratios are similar in all treatments except multiple-aeration. Loss of methane due to oxidation, as estimated from the difference between production and emission, is shown as percent oxidation in Figure 4. The curved line represents the average percent oxidation of the three included data sets. This graph shows that the percent oxidation increases from an insignificant amount early in the season when production is low, to an average value of of 73.1 +/- 13.7% between 36 and 69 days after normal flood. In the multiple-aeration treatment, the picture is not straightforward. There is a general trend in which production shuts down during the drained period but returns with increased values even though emission remains suppressed, indicating either very large quantities of methane oxidation during times of reflooding or a rapid turn on of production during the incubation experiment. This effect, however, was not observed in incubations of soil samples from the midseason aeration treatment.
Methane concentrations in soil pore water profiles were obtained in all fields at 16, 36, and 49 days after normal flood. Highest methane concentrations occurred in the normal floodwater treatment, peaking at from 5 to 10 cm below the soilwater interface at 130 UM on day 36 and nearly 300 UM on day 49. The late flood treatment did not show significant soil pore water methane until day 49 with a maximum concentration of 150 UM at 3 cm depth. The midseason aeration treatment data also showed no significant amount of pore water methane until day 49 when the methane concentration reached a peak value 75 UM at a depth of 6 cm. The pore water methane concentration in the multiple-aeration treatment was never observed to be more than 3 UM at any depth.
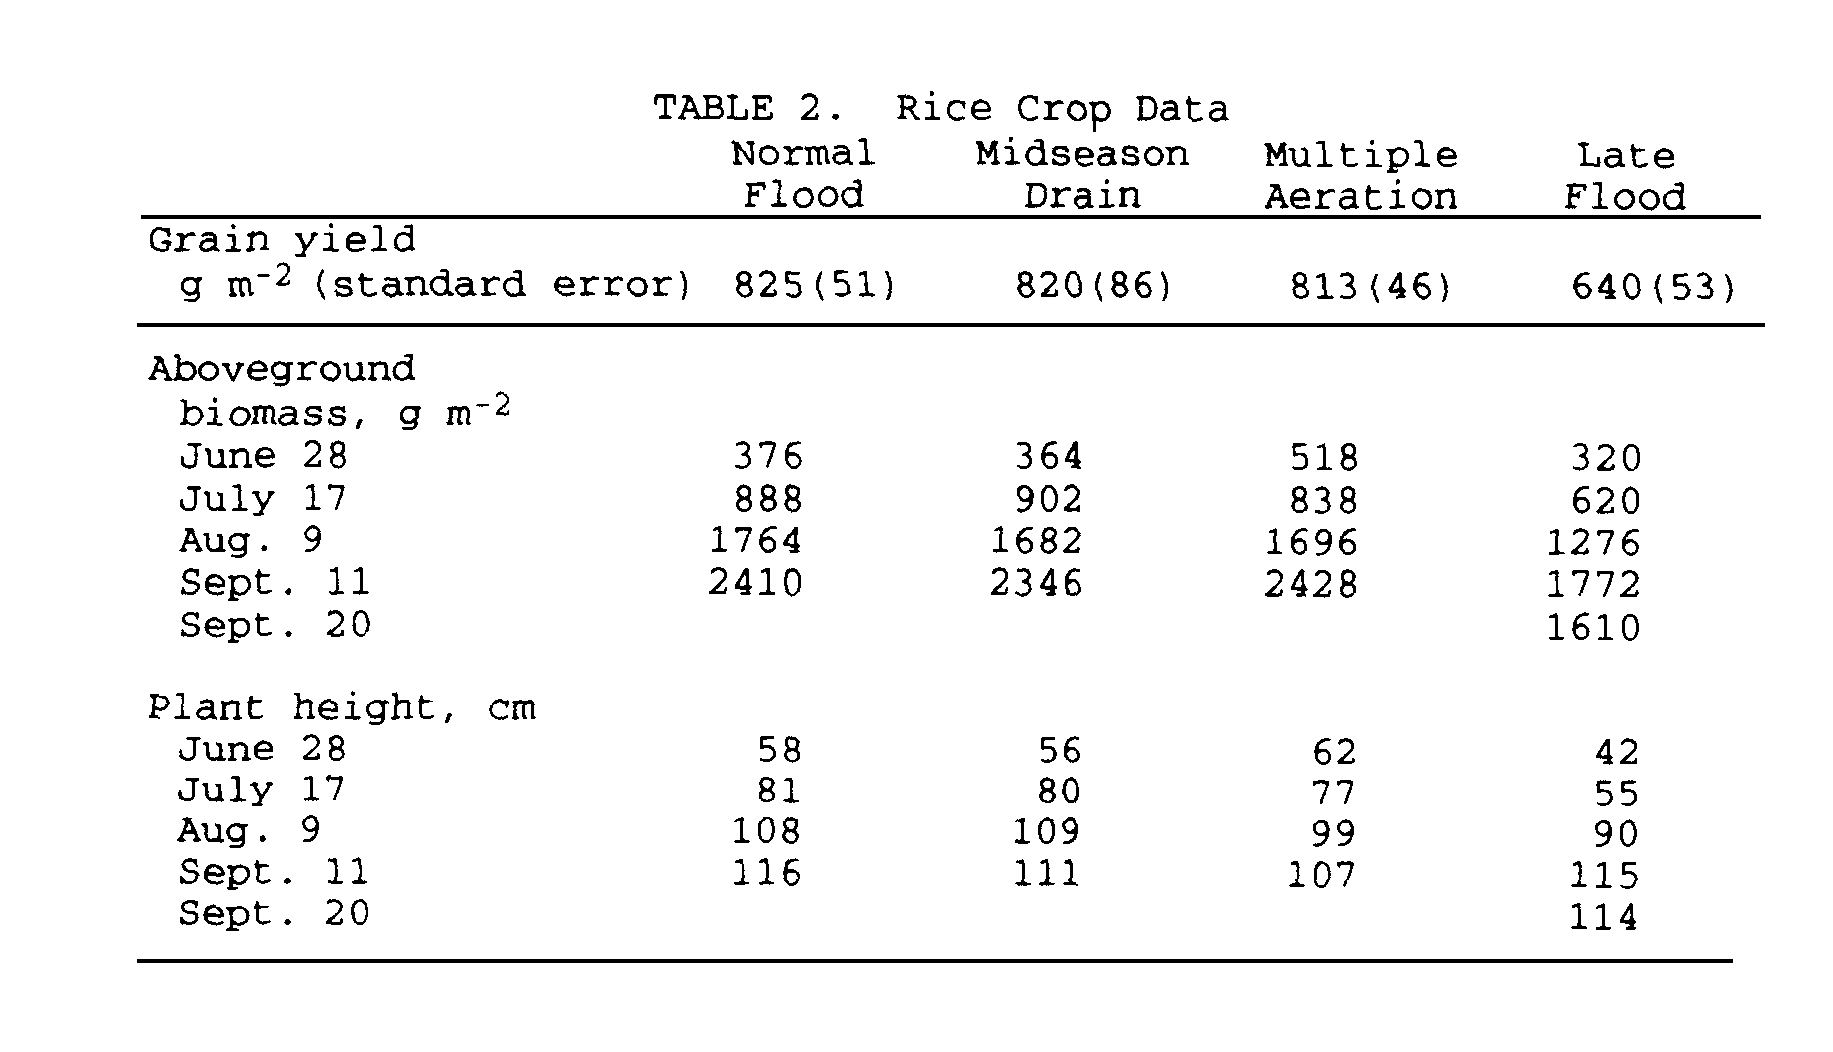
3.3. Plant Biomass and Grain Yield
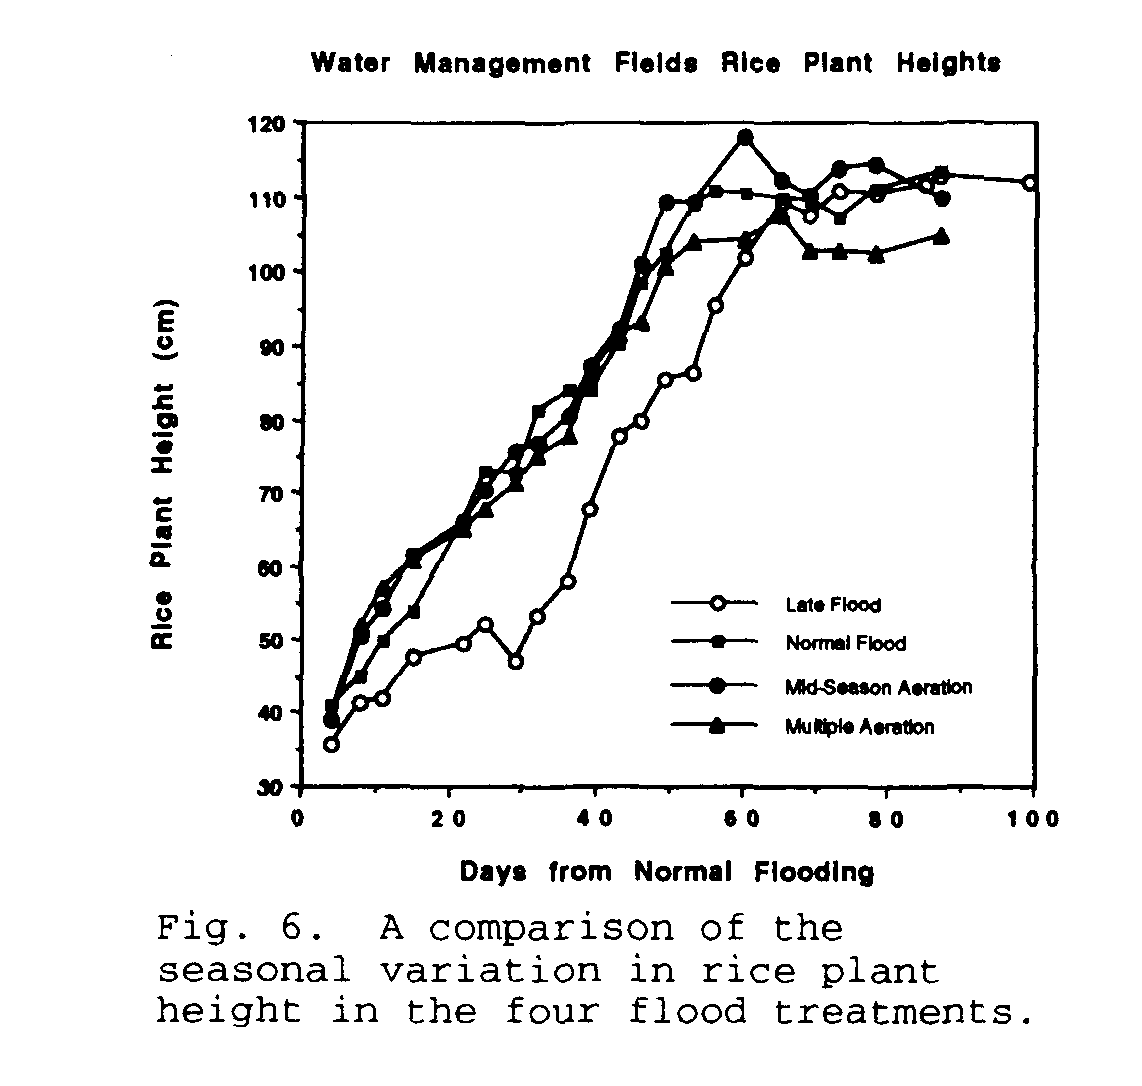
Total live aboveground rice plant biomass is shown in Figure 5 at various times after normal flood. The total biomass is divided into leaves plus stems and panicle (after emergence) for each experimental treatment. Values of total aboveground biomass are presented in Table 2. Except for the late flood treatment, there is no statistical difference between treatments for either total biomass or panicle weight. The late flood treatment shows late panicle emergence and lower biomass at all dates, with leaves and stems decreasing in weight on day 95, after other treatment fields had been drained. This loss is probably due to loss of leaves from early senescence. Plant heights are shown in Figure 6 and again show good agreement among treatments except for a lag in plant height in the late flood treatment. Grain yields are given in Table 2 and show consistently good yields, equal in all cases except an approximate 22% reduction in yield in the late flood treatment.
We have observed that a short-term (2 day) accidental draining of a rice field [Sass et al., 1990] was effective in severely reducing methane emission. We have also observed that laboratory incubations (unpublished) of slurries made from rice field soil require a minimum incubation time of approximately 2 weeks before significant methane production is observed. These observations indicate that short-term (2-3 day) drained periods periodically throughout the rice growing season may be sufficient to appreciably reduce methane emissions without adversely affecting rice yields.
4.1. Normal Floodwater Treatment
For purposes of comparison, in one field the normal or conventional floodwater treatment was used. It consisted of a continuous 10 cm flood beginning 7 weeks after planting and continuing for 81 days (until about 10 days before harvest). Its observed seasonal variation in methane emission is shown in Figure 2a. Daily average and seasonal total emission are given in Table 1. The day-to-day variation in the seasonal methane emission function is very similar to that observed in many seasonal studies [e.g., Schütz et al., 1989a; Sass et al., l991a, b].
Methane production values, estimated from soil incubations, are also shown in Figure 2a. In general, they tend to increase throughout the season in a manner similar to the emission values. Methane produced in the soil will either be oxidized by methanotropic organisms in the soil or be emitted to the atmosphere. An estimation of the rate of methane oxidation is the difference between production and emission. These calculated values are presented in Table 3 along with similar data from a 1985 study in Vercelli, Italy [Schütz et al., 1989b]. Although the levels of methane production and emission are quite different in the two studies, the percent of oxidation compares surprisingly well, both in magnitude and seasonal trend. Our data start at lower relative methane magnitude and lower rates of oxidation, but both data sets indicate an initiation period for the oxidation followed by a saturation rate of between 60 and 90 percent over the second half of the growing season.
4.2. Multiple-Aeration Water Treatment
When compared to the normal uninterrupted flood, the most dramatic reduction in methane emission was from the multiple-aeration drainage regime. In this treatment, methane emission dropped to 12% of control. The observed seasonal variation in methane emission is shown in Figure 2c. Daily average and seasonal total emission are given in Table 1. If the first drain had taken place 2-3 days earlier in the season, the one high methane peak observed on the twenty-fifth day after permanent flood may not have developed and the seasonal reduction in emission may have been much stronger. Nevertheless, two additional short drain periods (2-3 days), each separated by three weeks, were sufficient to prevent methane emissions from being reestablished.
Methane production values in the multiple-aeration treatment are also shown in Figure 2c. As in the normal flood treatment the production values initially rise with emission. But unlike normal water treatment, a week after the first drain, while emission is still small (7.9 mg m-2 d-1) production appears to be large (231.3 mg m-2 d-1) indicating 97% oxidation. This same effect was observed just before the third drain when methane production was measured at 410.0 mg m-2 d-1 and emission was only 6.7 mg m-2 d-1 or 98% oxidation. Thus in both periods, either oxidation rates remained very high between drains or high production was induced during the short incubation period. The later case seems unlikely because both production and emission were observed to be very low in incubation experiments conducted on core samples taken during both the second and third drain events.
4.3. Midseason Aeration Water Treatment
The second most effective water treatment in reducing methane emission was a midseason aeration, similar in timing to that practiced in many parts of Japan and reported by Yagi and Minami [1990]. The observed seasonal variation in methane emission is shown in Figure 2b. Daily average and seasonal total emission are given in Table l. In our study, this midseason drain was timed to be somewhat after the first drain of the multiple-aeration treatment in order to more closely adhere to Japanese management practices. Consequently, methane emissions had increased to peak values before being suppressed by the drain. The time period during which the field was drained was longer (6 days) than that used in the multiple-aeration treatment. Interestingly, the time course of the recovery of methane emission until the second drain were very similar between the two treatments. In the midseason drain treatment, methane emission continued to rise until the final drain before harvest, resulting in a seasonal methane emission which was 52% of the control.
Seasonal methane production rates for the midseason aeration treatment are shown in Figure 2b. They correlate with observed emission rates in a manner similar to that observed in the normal flood treatment even though emission is suppressed by the midseason drain. Figure 4 shows that calculated oxidation rates recorded during the season are comparable to those observed in the normal flood treatment. When compared to multiple-aeration treatment, the production rates have a similar behavior, but emission rates are reestablished after draining only in the prolonged second flooding in the midseason aeration treatment. This observation indicates that the activity of the methane oxidizing organisms may be enhanced by the more frequent aerations in the multiple-aeration treatment.
4.4. Late Floodwater Treatment
The third and least effective water management treatment was the late flood. The observed seasonal variation in methane emission is shown in Figure 2d. Daily average and seasonal total emission are given in Table 1. As expected, even though the soil remained moist due to precipitation events, the month delay in applying the floodwater suppressed methane emission until about a week after floodwater addition (day 44). At that time however, methane emission rose steadily to a peak value over two and one-half times greater than that observed in the other irrigation treatments but eventually decreased to more expected values later in the season. In addition, because of the late flood, the rice plants did not mature as quickly as in the other water management treatments resulting in an additional period of methane emission due to delayed crop maturity and drain date. Because of these two features (enhanced methane emission and delayed drain), the seasonal total from the late flood treatment was the highest of any of the treatments; 1.6 times that observed in the normal water treatment.
Seasonal methane production rates for the late floodwater treatment are shown in Figure 2b. They correlate with observed emission rates in a manner similar to that observed in the normal flood treatment even though emission is suppressed during the early part of the season due to the absence of floodwater. Figure 4 shows that calculated oxidation rates recorded during all seasonal phases are comparable to those observed in both the normal flood and midseason aeration treatments. These experiments also indicate that the early lack of permanent floodwater did not interfere with the development of the plant gas transport system for methane emission. If it did, it is likely that methane emissions values would be less that were observed relative to both the production values observed and the methane emission rates from the normal treatment.
4.5. Effects of Water Treatment on Rice Productivitv
We have followed recommended procedures for maintaining good rice plant growth and crop yields. For example, we were careful not to allow water stress during panicle development or flowering, which results in yield reduction [Stansel, 1975]. For the variety Jasmine 85, this critical water stress period has been determined to be from 75 to 105 days after planting and is considered as the shortest permanent flooding period consistent with normal grain yields. In the late flood treatment, floodwater was applied 76 days after planting and maintained until 10 days prior to harvest.
Keeping the soil saturated or very wet instead of flooded often reduces rice yields because of changes in bulk density, diffusion characteristics, nutrient availability, and buffering systems [U.S. Environmental Protection Agency, 1991]. For this reason, in the midseason and multiple-aeration treatments, drain periods were kept short, lasting no more than 2 or 3 days. Also, the drain periods were timed so as to not come at critical times in plant development, such as anthesis and fertilization. Three days of drought at 11 days and at 3 days before heading reduces yield significantly by causing a high percentage of sterility. Water deficits during the vegetative stage may reduce plant height, tiller number, and leaf area, but yield will not be affected by the retarded growth if water is supplied in sufficient time to permit the plant's recovery before flowering [Yoshida, 1981].
Aboveground biomass values and plant heights are given in Table 2. A four treatment comparison of aboveground biomass, separated into leaves and stems and panicle weight, is shown in Figure 5. A comparison of plant heights throughout the flooded part of the season is presented in Figure 6. Biomass values at 11 days after normal flood were all statistically the same. The late flood field was permanently flooded 30 days after the normal flood. Biomass measurements on that day show the late flood to be values to be only 74% that of the other three treatments, all of which were statistically identical. This trend persisted throughout the experiment. The late flood treated plants lagged the otherwise treated plants both in reaching a certain developmental stage and in biomass. One can see for example that the biomass data for day 53 does not show any panicle development for plants in the late flood treatment, yet the other three treatments all show well-developed panicle weights. Also, because of the increased growth period and late maturation of the rice in the late flood treatment, many of the plants were exhibiting senescence and loss of leaves. This phenomenon may be a cause for the lower biomass observed in the late flood treatment. The seasonal course of plant height shows that plant heights in all treatments, except for the late flood, are statistically equal at all times The plant heights in the late flood treatment lag behind most of the season but catch up with the other three at about day 65. All four treatments show the same heights from that point until the end of the experiment.
Rice grain yields are given in Table 2. As in the case of live biomass, yields are statistically equal in all treatments except late flood in which the grain yield was only approximately 70% that of the other treatments. Yield values were also quite high in these treatments, indicating that neither the midseason nor the multiple-aeration treatment had an adverse effect of grain yield. A possible cause for the loss in grain yield in the late flood treatment may be due to the reallocation of translocatable carbohydrate from grain formation to a root system which was stressed by an insufficient water supply. We have postulated such an event in cases where root stress was caused by increased soil organic carbon and where fermentative metabolic byproducts from that carbohydrate were exudated into the rhizosphere to be eventually consumed by methanogens. In such a process, we calculated that a loss of carbohydrate equivalent to a decrease in rice grain yield of 1 g m-2 corresponds to an increase in methane emission of 0.073 g m-2 [Sass et al., l991a]. In the current study, the difference in grain yield between normal flood and late flood treatments was observed to be 825-640 = 85 g m-2. This value would predict an increase in seasonal methane emission of (85)(0.073) = 6.2 g m-2. We observed an increase in seasonal methane emission of 5.7 g m-2.
4.6. Water Requirements
A water usage summary for all four treatments is given in Table 4. It is recognized that in other years when rain is more or less than in 1991, these water use figures may differ significantly. Total precipitation for the late flood treatment is lower than in the other three treatments because of higher rainfall during June which ran off the fields before the late flood treatment was established and because of lower rainfall during September when only the late flood treatment was flooded. Although pan evaporation is not a good measure of evapotranspiration, pan evaporation is provided because we did not measure evapotranspiration and could not estimate it from available information. The irrigation water added includes both reflooding water and daily additions to maintain a constant flood level of 100 mm. The amount of irrigation and precipitation needed to establish or reestablish a 100-mm flood is roughly 100-130 mm as shown by the data and illustrates why the multiple-aeration required the most water. The multiple-aeration treatment, relative to the conventional or normal floodwater treatment, reduced methane emission by almost 90% with no decrease in grain yield in return for a fourfold increase in water use. The multiple-aeration management program can be employed to substantially reduce methane emission where water is readily available at a minimal cost or where stepwise drainage from higher to lower elevation can be accomplished. Where water is either limited or expensive, the midseason aeration can be used. It gives a reduction in methane emission by almost 50% with no decrease in grain yield in return for a twofold increase in water use. Surprisingly, a late flood increased methane emission by 60%, reduced grain yield almost 25%, but had a water requirement similar to the normal flood treatment.
Acknowledgments. This work was supported by grants from the U.S. Department of Agriculture and the U.S. Department of Energy National Institute for Global Environmental Change and funding from The Houston Lighting and Power Co., Inc. We thank Peter Adams, Patrick Eason, Jennifer King, Erica Ollmann, and Ryn Wu for their help in data collection.
Bouwman, A. F., Exchange of greenhouse gases between terrestrial ecosystems and the atmosphere, in Soils and the Greenhouse Effect, pp. 61-127, John Wiley, New York, 1990.
Hesslein, R. H., An in situ sampler for close interval pore water studies, Limnol. Oceanogr., 21, 912-914, 1976.
International Rice Research Institute, World Rice Facts, Los Baños, Philippines, 1989.
McAliffe, C., Gas chromatographic determination of solutes by multiple phase equilibrium, Chem. Technol., 1, 46-51, 1971.
Sass, R. L., F. M. Fisher, P. A. Harcombe, and F. T. Turner, Methane production and emission in a Texas rice field, Global Biogeochem. Cycles, 4, 47-68, 1990 .
Sass, R. L., F. M. Fisher, P. A. Harcombe,
and F. T. Turner, Mitigation of methane emissions from rice fields: Possible adverse effects of incorporated rice straw, Global Biogeochem. Cvcles, 5, 275-287, l991a.
Sass, R. L., F. M. Fisher, F. T. Turner, and M. F. Jund, Methane emission from rice fields as influenced by solar radiation, temperature, and straw incorporation, Global Biogeochem. Cvcles, 5, 335-350, l991b.
Schütz, H., A. Holzapfel-Pschorn, R. Conrad, H. Rennenberg, and W. Seiler, A 3-year continuous record on the influence of daytime, season and fertilizer treatment on methane emission rates from an Italian rice paddy, J. Geophys., 94, 16,405-16,416, 1989a.
Schütz, H., W. Seiler, and R. Conrad, Processes involved in formation and emission of methane in rice paddies, Biogeochemistry, 7, 33-53, 1989b.
Stansel, J. W. The rice plant-its development and yield, in six Decades of Rice Research in Texas, pp 9-21, The Texas Agricultural Experiment Station, J. E. Miller, Director, College Station, 1975.
U. S. Environmental Protection Agency. Sustainable rice productivitv and methane reduction research plan, edited by B. V. Braatz and K. B. Hogan, pp. 25-26, Air and Radiation, Washington, D. C., 1991.
Yagi, K. and K. Minami, Effects of organic matter application on methane emission from some Japanese paddy fields, Soil Sci. Plant Nutr. Tokyo, 36, 599-610, 1 990 .
Yoshida, S., Fundamentals in Rice Crop Science, International Rice Research Institute, Los Baños, Philippines, 1981.
__________
F. M. Fisher, R. L. Sass and Y. B. Wang, Department of Ecology and Evolutionary Biology, Rice University, Houston, TX 77251.
M. F. Jund and F. T. Turner, Texas Agricultural Experiment Station, Texas A&M University, Beaumont, TX 77713.
(Received April 14, 1992; revised July 6, 1992; accepted July 14, 1992.)
Copyright 1992 by the American Geophysical Union. Paper number 92GB01674 0886-6236/92/92GB-01674$10.00