 Reproduced, with permission, from:
Roller, N. E. G., and J. E. Colwell. 1986. Coarse-resolution satellite data for ecological surveys. Bioscience 36 (7): 468-75.
Reproduced, with permission, from:
Roller, N. E. G., and J. E. Colwell. 1986. Coarse-resolution satellite data for ecological surveys. Bioscience 36 (7): 468-75.
Since the first Landsat was launched in 1972, satellite data have contributed significantly to large-area inventory and monitoring tasks (e.g., MacDonald and Hall 1978). One of the few criticisms of original Landsat multispectral scanner (MSS) data was that the resolution (80 m) seemed too coarse for some applications. A great deal of interest has therefore accompanied recent launchings of Landsats 4 and 5 with their thematic mapper (TM) sensors and France's SPOT, which offer data of considerably finer resolution than those available from Landsats 1, 2, and 3. For many tasks, high-resolution TM and SPOT data will undoubtedly be helpful.
On the other hand, some investigators are exploring a very different proposition (e.g., Schneider et al. 1981): that data with coarser resolution than Landsat MSS data, such as those available from National Oceanic and Atmospheric Administration (NOAA) satellites, will also be useful for certain applications. These applications include inventory, monitoring, and biophysical characterization of very large areas, considerably larger than the approximately 34,000 km[2] in a single Landsat scene. Furthermore, NOAA satellite data are especially useful for tasks requiring frequent coverage or coverage on a key date. This article discusses some of the demonstrated and potential uses of NOAA satellite data for such work.
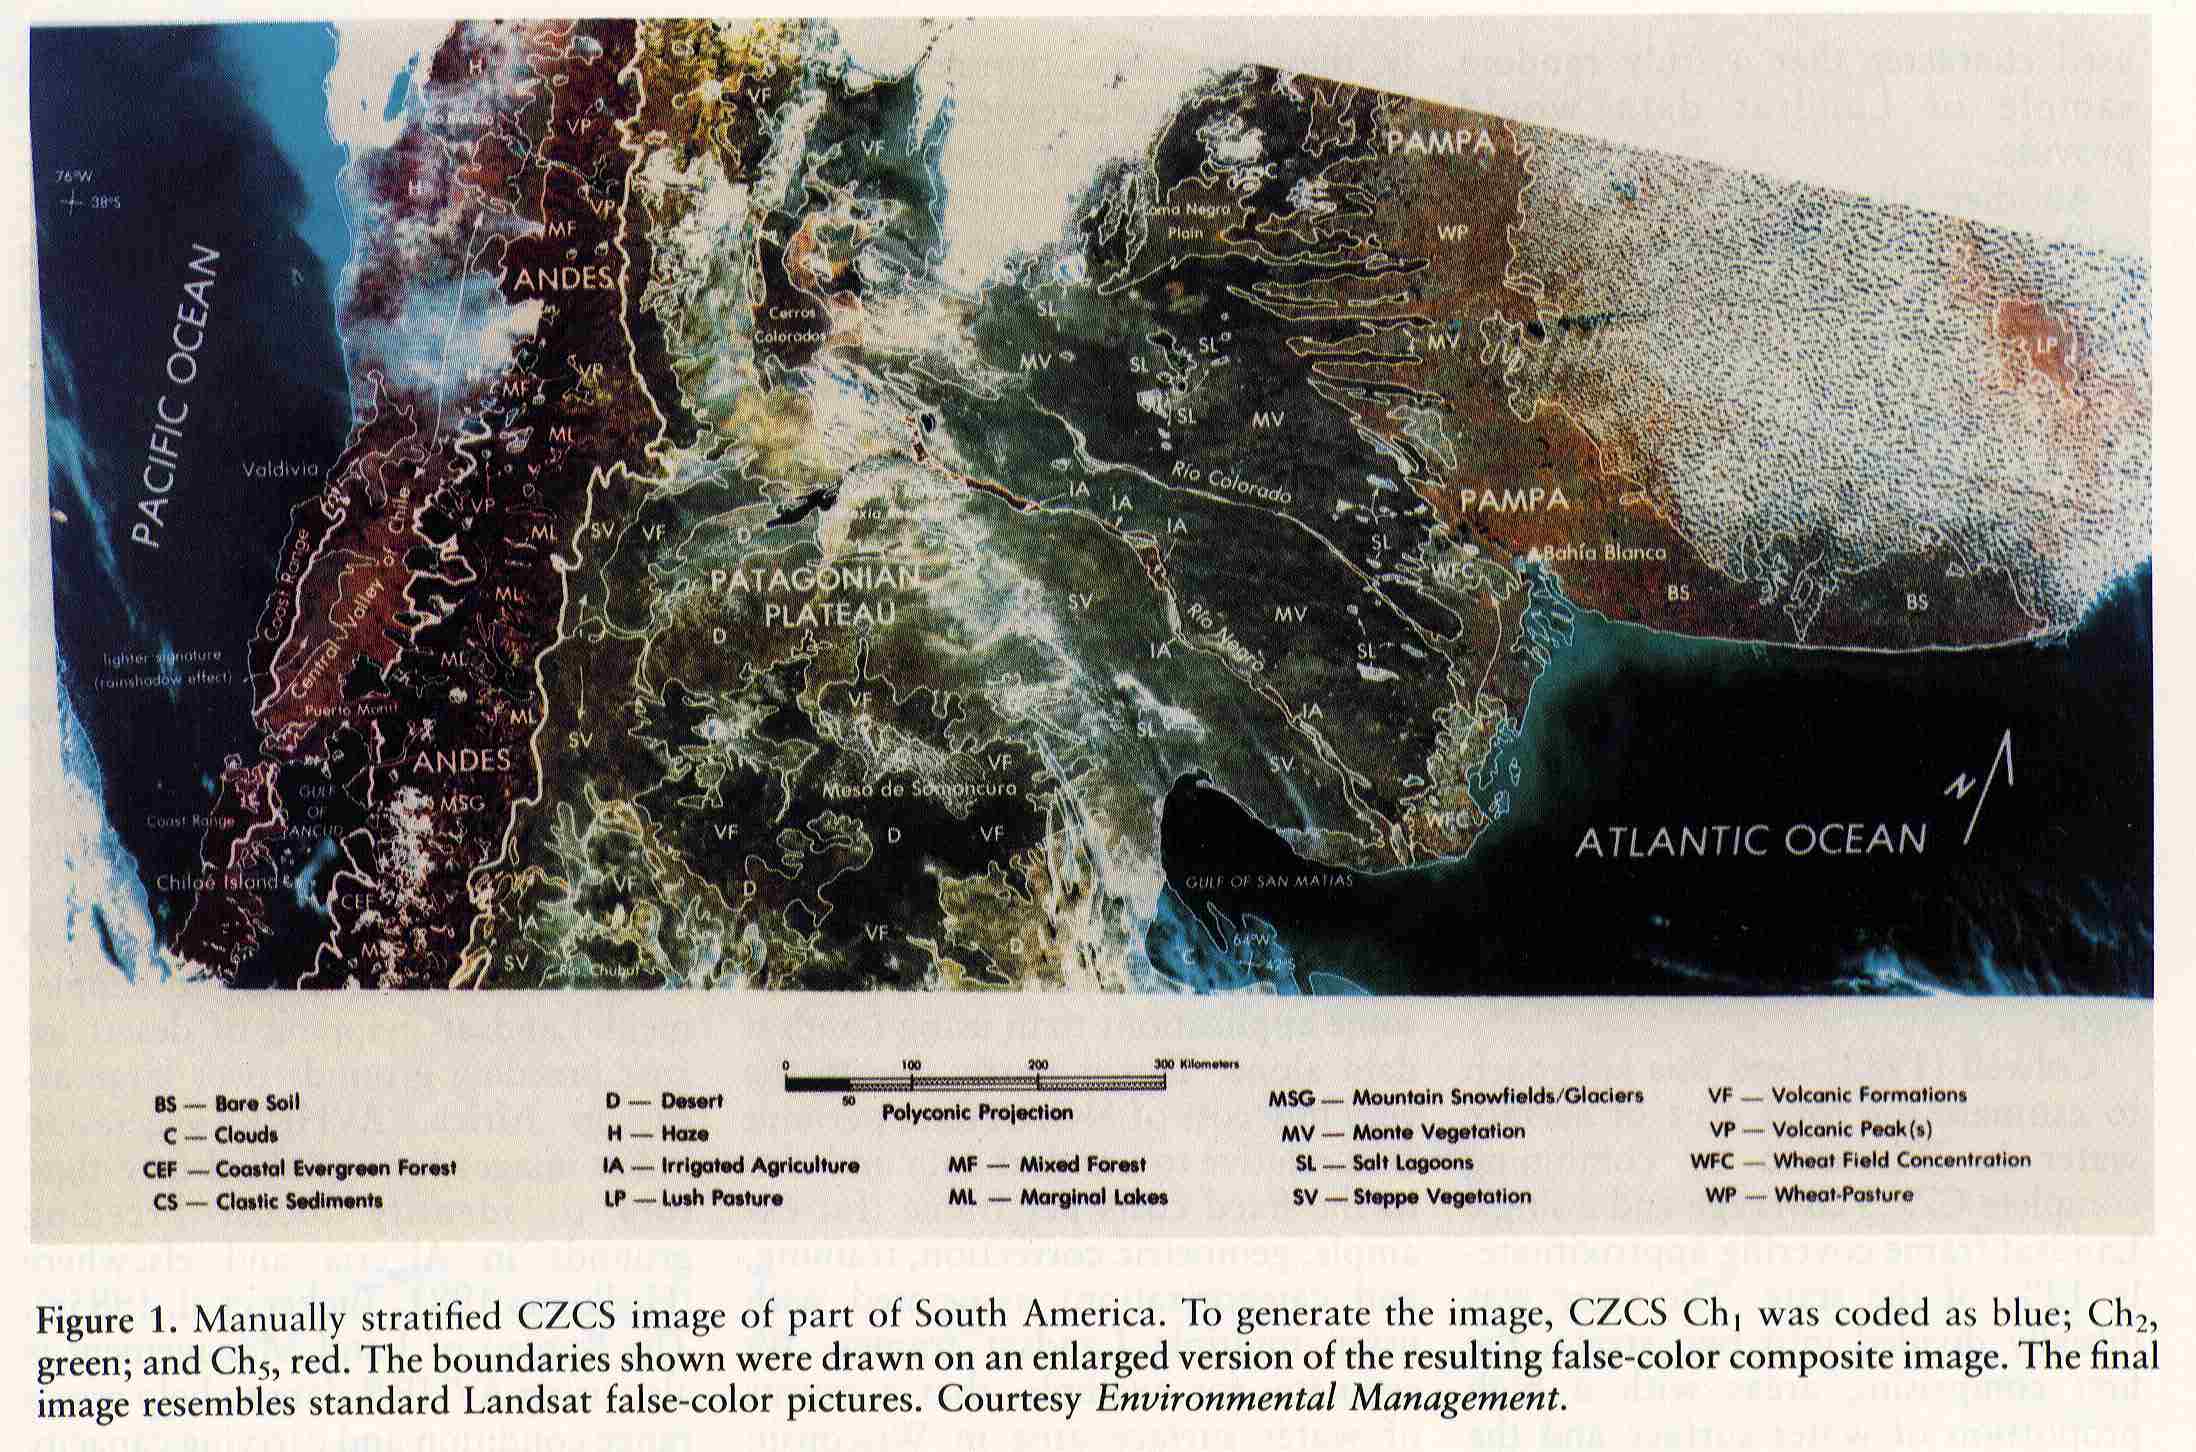
NOAA satellite data are acquired by the advanced very high resolution radiometers (AVHRR) aboard NOAA 6, 7, 8, and 9 and the coastal zone color scanner (CZCS) aboard Nimbus-7. Table 1 shows some of the important differences between NOAA satellite and Landsat MSS data; note especially the differences in area covered, resolution, and frequency of coverage. Table 2 compares the spectral bands observed by these sensors. The spectral bands differ largely because the satellites have different primary missions. CZCS was designed for oceanographic applications (see Perry 1986, p. 461 this issue), AVHRR for meteorological purposes, and Landsat MSS for studying terrestrial resources. The sensors also differ in the relative cost of the data they gather. The price per unit area of CZCS data is about 1%, and AVHRR data about 0.1%, of the price per unit area of Landsat MSS data. Characteristics like these determine the relative merits of NOAA satellite data for the ecological surveys we describe below.
Stratification is the process of dividing a region into subunits so that a resource or feature of interest is more uniform within the subunits (strata) than over the region as a whole. Subsequent characterization of this resource over a single stratum is then likely to be more precise because the variance within the stratum is less. Effective stratification is an important first step for many inventory or monitoring tasks. It is an essential component of the estimation procedures for crop statistics used by the US Department of Agriculture (USDA 1964). Stratification is also a key element in designing inventories in developing countries, where knowledge of existing resources and conditions may be somewhat limited. For example, stratification using Landsat MSS data before field sampling increased the efficiency of an agricultural inventory in Libya by over 300% (Allan et al. 1982).
For regional analyses (studying areas larger than one Landsat scene), NOAA satellite data offer several advantages for stratification. The wide field of view from NOAA satellites permits imaging large areas simultaneously. A single AVHRR image, for example, covers an area equivalent to more than 100 Landsat images, although variable angle of view and bidirectional reflectance reduce the usable area to some fraction of the total image (Duggin et al 1982). In addition, since effective stratification does not depend on resolving details, the procedure may be simpler with coarse-resolution data, and regional patterns may become more obvious.
Proper stratification of a large area is also easier from an image obtained at essentially one point in time, hence under similar phenological and illumination conditions. Landsat generally cannot furnish such data since many images, acquired on several dates, must typically be mosaicked to cover a large area. For example, during a soils mapping project in Mali that used Landsat MSS data for stratification, phenological and other differences in data acquired on different dates produced tonal differences among the images that were unrelated to fundamental terrain properties. These artificial temporal discrepancies made both stratification and labeling strata more difficult (Mali MRD 1983), a problem that could well have been mitigated by NOAA satellite data.
NOAA satellites are also considerably more likely than Landsat to obtain suitable data over very large areas. This potential derives not only from NOAA satellites' large fields of view but also their greater frequency of coverage. The greater the frequency, the greater the opportunity to acquire cloud-free images, which is especially difficult in wet, tropical regions. For example, Tucker et al. (1985a) were able to obtain several cloud-free NOAA AVHRR images of a sub-Sahelian study area for which no cloud-free Landsat MSS data had ever been obtained.
Figure 1 illustrates manual stratification of a portion of South America using NOAA satellite data. More than 30 Landsat MSS images would be required to cover this area. Major physiographic regions delineated include the southern and western portions of the Argentine Pampa, a major production site of beef cattle, wheat, and alfalfa; the northern portion of Patagonia, an extensive dry area of steppe and desert vegetation dominated by the dissected Patagonian Plateau and wind-eroded hills; the largely forested southern Andean mountain system; the central valley of Chile and geologically related fjord coast; and the Chilean coast range bordering the Pacific Ocean.
This example illustrates stratification based on static features of the landscape. One can also perform dynamic stratification based on temporally changing phenomena such as vegetation condition or phenology, which may be equally important for compiling inventories efficiently. NOAA satellite data may be especially useful in dynamic stratification, because they are gathered so often.
Dynamic stratification was recently used in an agricultural inventory in central Sudan (Sellman et al. 1986). AVHRR data for approximately the same dates late in the growing seasons of 1984 and 1985 were first transformed using a normalized difference vegetation index (NDVI),[1] then digitally merged, and a difference image (first date minus second date) prepared.[2] NDVI is sensitive to the relative amount of incident solar radiation reflected in AVHRR visible (Ch1) and near-infrared (Ch2) spectral bands. Since photosynthetically active vegetation reflects less visible than near-infrared solar radiation, higher index values indicate where more green vegetation is present. Thus, the difference image can reveal areas where vegetation was in the same condition in the two years (no difference), worse in 1984 than 1985 (negative values), and better in 1984 than 1985 (positive values). Analysis of this image indicated widespread crop failure in the northern part of the country, and subsequent field visits and conversations with Sudanese agronomists confirmed that lack of late-season rain had indeed caused such a failure.[3]
The satellite image helped improve the precision of this agricultural survey by making it possible to draw a boundary between the zone of crop failure and the remaining area, thereby reducing the total area that needed to be sampled as part of the harvested crop area estimation procedure. Thus, more samples could be taken from the area in which the crop was harvested.
When it is difficult or impossible to obtain Landsat data that either cover the entire study area, provide coverage at the proper time of year, and/or do not exceed available funds, coarse-resolution satellite data may represent a reasonable alternative source.
There are several ways an inventory could be produced with NOAA satellite data, with or without the aid of other sources. One could rely solely on coarse-resolution data, categorize[4] it (either digitally or manually), and accept its resolution limits. The digital approach was taken by Gervin et al. (1983) who produced a land-use map for the Washington, DC, area from AVHRR data. In this study, categorization accuracy for US Geological Survey Level I land use categories[5] obtained using AVHRR data were similar to categorization accuracies for Landsat MSS data (71% and 76%, respectively).
In another approach, one could use the spectral and temporal information available from multiple acquisitions of AVHRR data. This approach can work well since some vegetation communities produce a similar spectral response when observed at only one point in time, but give a more distinctive spectral-temporal response when observed over a longer period. Tucker et al. (1985b) used AVHRR data to categorize vegetation communities in Africa based on eight composite observations from an 11-month period. These composites were created by producing images composed of the maximum NDVI value for each pixel during contiguous 21-day periods. Such composting and use of multitemporal data is feasible at continental scales only with coarse-resolution, repetitive coverage.
One way to estimate a resource's quantity using both NOAA and Landsat data, where only incomplete Landsat data are available or affordable, for example, would be to stratify the whole study area on the basis of complete NOAA satellite data and then extrapolate estimates made where Landsat data exist to the entire area according to the relative size of each stratum as determined from NOAA data. This procedure is similar to multistage sampling; however, it lacks the statistical rigor and unbiased character that a truly random sample of Landsat data would provide.
Another alternative would be to calibrate the categorization of NOAA satellite data with accurate categorization of Landsat data for a subregion of the study area, and then produce a calibrated census based on NOAA data for the whole study area. The objective of such calibration is to remove any bias arising from the reduced spatial and spectral resolution of NOAA satellite data. In effect, a limited number of high-cost, high-accuracy measurements are used to correct a census of low-cost, moderately accurate measurements. This procedure, called bias-correction, is similar to multiphase regression estimation but, again, lacks statistical rigor.
Colwell (1983) used this approach to estimate the total area of surface water in Wisconsin by combining complete CZCS coverage and a single Landsat frame covering approximately 12% of the state. The state was initially divided into two strata, the first comprising areas with a high proportion of water surface and the second, those regions without much water surface area. Separate Landsat-CZCS calibration relationships were established for each stratum. A complete CZCS census of the water surface area was then prepared for each stratum and bias-corrected to produce a final, stratified, Landsat-calibrated CZCS estimate for the whole state. Both stratification and calibration improved the estimate. The result (497,400 ha) was within 6.8% of a comparable estimate prepared mainly from digitized topographic maps by the Wisconsin Department of Natural Resources.
The above approach has also been used to prepare agricultural inventories. For example, Bhuiyan et al. (1986) estimated the irrigated agricultural land in western Nebraska in 1984 using AVHRR and 1:250,000 Landsat MSS imagery. Based on previous studies, they stratified the study area, in the northwestern part of the state, into zones of high-, medium-, and low-density irrigation. They then established separate Landsat-AVHRR calibrations for each stratum based on visual interpretation of a 1:250,000 Landsat MSS image. Finally, these bias-correction relationships were applied to categorized AVHRR digital data for each stratum to provide a stratified, Landsat-calibrated AVHRR estimate for the entire study area (144,722 ha).
Procedures like these can be particularly useful where timeliness is important. For example, although the Landsat-AVHRR estimate of irrigated agricultural land for 1984 was not begun until spring 1985, it was nevertheless completed before the Nebraska Department of Agriculture's corresponding estimate for that region was available.
Even if complete Landsat data are available for a large-area inventory, combining complete NOAA satellite data and a subset of Landsat data may prove more cost effective for some applications than using Landsat data alone. This is partly due to the very low cost of NOAA data per unit area relative to Landsat data and also to the fixed costs per frame (for example, geometric correction, training, and categorization) associated with using multiple Landsat frames. We estimate, for example, that a census of water surface area in Wisconsin based on complete Landsat coverage would have cost about eight times as much as the stratified, Landsat-calibrated CZCS estimate described above.
NOAA AVHRR vegetation indices are highly correlated with Landsat MSS vegetation indices and hence with vegetation condition (Gray and McCrary 1981, Townshend and Tucker 1984). Information from NOAA satellite data on current growing conditions could be used to detect and delimit regions of crop stress and potential production shortfalls in timely fashion.
Figure 2 illustrates how NOAA AVHRR data can help assess vegetation condition over large areas. This normalized vegetation index image prepared from one-kilometer resolution AVHRR data shows the condition of vegetation over much of the southwestern United States in June 1982. Of particular interest for assessing crops is the obvious difference in crop condition north and south of the US-Mexican border (near the Salton Sea), a result of different crop management practices.
NOAA's Assessment of Information Services Center (AISC) is currently using NOAA satellite data along with other information (e.g., ground meteorological data) to estimate potential crop failure (Hock 1984). The center generates two key products: precipitation estimates and vegetation condition estimates. The visible and thermal infrared AVHRR channels are used to augment ground station precipitation reports to estimate rainfall; vegetation condition estimates are based on AVHRR vegetation indices. These products enable researchers to forecast crop shortfalls early, and so begin mitigation efforts.
NOAA AVHRR imagery is also being examined as a way to supplement Landsat mapping of desert locust breeding grounds over large areas in Africa. AVHRR vegetation index images have enabled investigators to identify locust breeding grounds in Algeria and elsewhere (Hielkema 1981, Tucker et al. 1985c). The Bureau of Land Management is also using AVHRR data to help assess range condition and carrying capacity in the southwestern United States (NOAA 1982).
NOAA satellite data can also help in detecting changed land use patterns, which is especially important for updating natural resource maps and statistics. Since areas that have not changed may not need to be re-inventoried, delineating areas of significant change within a region may enable scientists to concentrate on this changed subset of the whole area, thus making updating more efficient (e.g., Sanders 1983).
AVHRR data can also help quantify rates of change. Tucker et al. (1984) recently used AVHRR data to detect and quantify the area of tropical forest clearing in a large remote area of Brazil. By comparing this AVHRR-based estimate with other available information, they concluded that previous estimates of forest clearing rates in that area were too low.
NOAA satellite data are especially useful for mapping phenomena that change very rapidly over a large area, as in Figure 3. This image was prepared by geometrically correcting and digitally overlaying two sets of Nimbus-7 CZCS data, collected one month apart (May and June), and then preparing a false-color composite image based on a subset of available spectral bands.
The image shows several significant changes, including a large decrease in snowpack (dark blue area), senescence in grassland vegetation (orange/yellow), and new wildfires (black). It would be difficult or impossible to monitor such rapid changes over such a large area (approximately 500,000 km[2]) with Landsat because it would be difficult to get enough Landsat frames from the proper dates.
Studies of resources and processes over subcontinental or global areas are also possible using coarse-resolution satellite data. NOAA's Satellite Data Services Division produces global weekly summaries of AVHRR data, which are based on a sample of global area coverage (GAC) AVHRR data (with a nominal ground resolution of 4 km[2]). The sample of GAC pixels for each observation is mapped into a polar stereographic projection for the northern and southern hemispheres. Effective resolution of these images ranges from 15 km at the equator to 30 km at the poles. The daily observations are composited over a seven-day period by saving the maximum NDVI value calculated for each pixel location over the compositing period (NOAA 1984). This maximum-value compositing minimizes cloud cover, which has very low NDVI values. Mapping and monitoring changes in vegetation condition at continental and global scales are possible using these data (Roller 1985, Roller et al. 1986, and Tucker et al. 1985a,b).
Figure 4 shows changes in vegetation condition in the Northern Hemisphere during summer 1983. This image was prepared by creating NDVIs from AVHRR global summary data for May and August and digitally combining them with one channel of untransformed data (channel 1, May). Clearly visible are the winter wheat-growing region in the southern US Great Plains (red), the summer corn-growing region south and west of the Great Lakes (green), and changes in vegetation condition in African grasslands (green fringe just south of the Sahara and red area in Somalia). The change in vegetation condition in California's Central Valley (seen at point B in Figure 3) is also visible here as a small U-shaped reddish feature.
A major problem in many subhumid and semiarid regions is desertification, whose effects can be detected by remote sensing (Tucker et al. 1985a). Such monitoring capability will undoubtedly be useful, but the ability to detect and measure the factors causing desertification would have even greater value. Modeling experiments have identified albedo (the ratio of solar energy reflected from the earth's surface to incoming solar radiation) as an important factor in desertification. Charney et al. (1975) hypothesize a positive feedback mechanism resulting from either an initial destruction of vegetation or an initial reduction in rainfall. In either case, the initial vegetation reduction reportedly leads to an increase in albedo, setting in motion a cascade of micrometeorological events, which in turn continue to reduce rainfall. The net effect is a reduction in rainfall near the primary desertification zone that spreads outward with time.
Testing this hypothesis requires a method of mapping albedo over large areas. In response, we have implemented a procedure for producing albedo maps from AVHRR data (Roller et al. 1986). Our study used AVHRR GAC weekly summary data from August 1983 and 1984. Comparing NDVIs for both dates indicated a definite decrease in vegetation along a belt south of the Sahara. In contrast, the corresponding albedo images for the same data do not show any significant change in albedo in the same area. Although it is too early to conclude that the general correlation between desertification and albedo does not hold, this study suggests there may be situations where different relationships operate. We must understand these relationships if we are to mitigate the effects of desertification.
Vegetation indices derived from infrared and visible remote sensing data have been found to be highly correlated with photosynthetically active radiation absorbed by plant canopies (e.g., Kumar and Monteith 1982). In addition, vegetation indices integrated with respect to time have been shown to be highly correlated with the total dry matter accumulation of plant canopies (e.g., Tucker et al. 1981).
Tucker et al. (1985a) used AVHRR data obtained at frequent intervals during the growing season to monitor grassland production in the Sahel. The integral of satellite NDVI data over the growing season was strongly correlated with end-of-season total dry biomass sampled on the ground. The authors also noted that key periods of biomass production were so short (< 18 days) that they could only be monitored with the high frequency of data acquisition by AVHRR.
Expanding on this approach, Tucker et al. (1985b) used eight composite observations of AVHRR vegetation index data to categorize the production of vegetation communities in Africa. Their results agreed reasonably well with other estimates of primary production for the different ecosystem types found there. Such a procedure would have been impractical without NOAA satellite data.
NOAA satellite data have several advantages over other remote sensing data for ecological and biophysical monitoring of large areas, including more frequent coverage and economy. They thus hold considerable promise for large-area characterization, inventory, and monitoring. For some applications (e.g., stratification), the data may be used alone, but for others (e.g., estimating area and biophysical characterization), they will probably be most useful in conjunction with other information, such as Landsat MSS and meteorological data and field observations. NOAA satellite data should prove especially valuable to ecologists because they offer previously unavailable opportunities to directly measure and map important ecological parameters at regional and global scales.
All color figures were produced by the Environmental Research Institute of Michigan.
Norman E.G. Roller and John E. Colwell are research scientists at the Environmental Research Institute of Michigan, P.O. Box 8618, Ann Arbor 48107. Both are developing methods for integrating a variety of data types in resource inventories. (c) 1986 American Institute of Biological Sciences.
3 R. Laurin, 1986, personal communication. Environmental Research Institute of Michigan.
Allan, J., J. Latham, J. Colwell, R. Reinhold, and E. Jebe. 1982. Monitoring the changing areal extent of irrigated lands of the Gefara Plain, Libya. Pages 1119-1126 in Proceedings of the First Thematic Conference on Remote Sensing of Arid and Semi-Arid Lands. Environmental Research Institute of Michigan, Ann Arbor.
Anderson, J.R., E.E. Hardy, J.T. Roach, and R.E. Witmer. 1976. A land use and land cover classification system for use with remote sensor data. US Geological Survey Prof. Pap. 964. US Government Printing Office, Washington, DC.
Bhuiyan, A.K.M.F., N. Roller, and J. E. Colwell. 1986. Regional inventory of irrigated agriculture through joint use of AVHRR and Landsat data. Pages 369-380 in Proceedings of the 19th International Symposium on Remote Sensing of Environment. Environmental Research Institute of Michigan, Ann Arbor.
Charney, J., P.H. Stone, and W.J. Quick. 1975. Drought in the Sahara: a biogeophysical feedback mechanism. Science 187: 434-435.
Colwell, J. 1983. Regional inventory by joint use of coarse and fine resolution satellite data. Pages 1077-1083 in Proceedings of the 17th International Symposium on Remote Sensing of Environment. Environmental Research Institute of Michigan, Ann Arbor.
Duggin, M., D. Piwinski, V. Whitehead, and G. Ryland. 1982. Evaluation of NOAA-AVHRR data for crop assessment. Appl. Opt. 21: 1873-1875.
Gervin, J., A. Kerber, and R. Witt. 1983. Comparison of level I land cover classification accuracy for MSS and AVHRR data. Pages 1067-1076 in Proceedings of the 17th International Symposium on Remote Sensing of Environment. Environmental Research Institute of Michigan, Ann Arbor.
Gray, T.I., and D.G. McCrary. 1981. Meteorological satellite data: a tool to describe the health of the world's agriculture. AgRI STARS Rep. EQ-NI-04042. NASA Johnson Space Center, Houston, TX.
Hielkema, J.U. 1981. Desert locust habitat monitoring with satellite remote sensing: a new technology for an old problem. ITC Journal 1981-4: 387--417.
Hock, J. 1984. Monitoring environmental resources through NOAA's polar orbiting satellites. ITC Journal 1984-4: 263-268.
Kumar, M., and J.L. Monteith. 1982. Remote sensing of plant growth. Pages 133-144 in H. Smith, ed. Plants and the Daylight Spectrum, Academic Press, London.
MacDonald, R., and F. Hall. 1978. LACIE: an experiment in global crop forecasting. Pages 17-48 in Proceedings of Plenary Session, LACIE Symposium. JSC-14551. NASA Johnson Space Center, Houston, TX.
Mali Ministry of Rural Development (MRD). 1983. Mali land and water resources. Report for USAID grant 688-0205, vol. 1. US Agency for International Development, New York.
National Oceanic and Atmospheric Administration (NOAA). 1982. Landsat data users notes 25. Eros Data Center, Sioux Falls, SD.
_____. 1984. Landsat data users notes 30. Eros Data Center, Sioux Falls, SD.
Perry, M.J. 1986. Assessing marine primary production from space. BioScience 36: 461-467.
Roller, N.E.G. 1985. Effective integration of data sources for optimizing resource inventories. Pages 1577-1603 in Proceedings of the 18th International Symposium on Remote Sensing of Environment. Environmental Research Institute of Michigan, Ann Arbor.
Roller, N.E.G., J.E. Colwell, and R. Aggarwala. 1986. Monitoring desertification through detection of land cover changes by albedo mapping with AVHRR data. Pages 809-820 in Proceedings of 19th International Symposium on Remote Sensing of Environment. Environmental Research Institute of Michigan, Ann Arbor.
Sanders, P.A. 1983. Use of multitemporal Landsat data in a forestry inventory update program. Pages 116-121 in Renewable Resources Management: Applications of Remote Sensing. American Society of Photogrammetry, Falls Church, VA.
Schneider, S.R., S.R. McGinnis, Jr., and J.A. Gatlin. 1981. Use of NOAA/AVHRR visible and near-infrared data for land remote sensing. NOAA Tech. Rep. NESS-84. National Oceanic and Atmospheric Administration, Washington, DC.
Sellman, A.. R. Aggarwala, J. Colwell, K. Ferguson, Jr., D. Hicks, D. Howes, R. Laurin, and N. Roller. 1986. Thematic mapper-derived acreage estimate of the 1985 millet/sorghum crop in western Sudan. ERIM Rep. 192700-1-F. Environmental Research Institute of Michigan, Ann Arbor.
Townshend, J.R.G., and C.J. Tucker. 1984. Objective assessment of advanced very high resolution radiometer data for land cover mapping. Int. J. Remote Sens. 5: 492.
Tucker, C.J., J.U. Hielkema and J. Roffey. 1985c. The potential of satellite remote sensing of ecological conditions for survey and forecasting desert-locust activity. Int. J. Remote Sens. 6: 127-138.
Tucker, C.J., B.N. Holben, J.H. Elgin, and J.E. McMurtrey. 1981. Remote sensing of total dry matter accumulation in winter wheat. Remote Sens. Environ. 11: 171-189.
Tucker C.J., B.N. Holben, and T.E. Goff. 1984. Intensive forest clearing in Rondonia, Brazil as detected by satellite remote sensing. Remote Sens. Environ. 15: 255-261.
Tucker, C.J., J.R.G. Townshend, and T.E. Goff. 1985b. African land-cover classification using satellite data. Science 227: 369375.
Tucker, C.J., C.L. Vanpraet, M.J. Sharman, and G. Van Ittersum. 1985a. Satellite remote sensing of total herbaceous biomass production in the Senegalese Sahel: 1980-1984. Remote Sens. Environ. 17: 233-249.
US Department of Agriculture (USDA). 1964. SRS misc. publ. 967. USDA Statistical Reporting Service, Washington, DC.