 Reproduced, with permission, from:
Colwell, J. E., and F. Sadowski. 1993. Past patterns as a guide for future forest management. Earth Observation Magazine 2 (2): 46-48.
Reproduced, with permission, from:
Colwell, J. E., and F. Sadowski. 1993. Past patterns as a guide for future forest management. Earth Observation Magazine 2 (2): 46-48.
Increasing pressure on the world's forest resources has resulted in increasing demands for effective forest management. This is one of a group of emerging global environmental problems that requires local management with a global perspective.
Although most of the attention has focused on the tropical forests of developing countries, such as Latin America and Asia, forests in developed countries are coming under increasing scrutiny. One of the areas in the United States that is being most closely examined is the temperate forest of the Pacific Northwest. Among the reasons it is of considerable interest are the decreasing amount of old growth forest and the implications of that dwindling resource for jobs, endangered species, and the global carbon cycle.
This article describes some uses of Landsat data to assess forests in the Pacific Northwest.
Increasingly, historical satellite data will emerge as a key source of data for understanding and managing forests. In part, this is because historical satellite data provides information about past conditions and changes in those conditions, which may be helpful in deciding how to manage forest resources in the future. The relatively low cost ($200 per scene) of some historical Landsat data sets is another reason for utilizing such information wherever possible. In addition, historical satellite data is potentially available over much of the globe, thereby allowing consistent historical information to be made available on a global basis. This is helpful because globally extensive information that is accurate, consistent, and temporally congruent has not been routinely collected in the past, and also because accurate global information is an important element in making wise decisions about the management of local resources.
For these reasons, extensive efforts to develop and use historical satellite data will become more common. One such effort is the developing Landsat Pathfinder Program, a NASA led effort to generate a large-volume, multitemporal data product for use by the global change science community. One of this program's activities is associated with developing a complete Landsat database for the humid, tropical forests of the Amazon Basin, Central Africa, and Southeast Asia (see December issue article by Lawrence & Chomentowski). Another activity is the North American Land Characterization Project, funded by the Environmental Protection Agency, which will bring together three dates of historical Landsat data in a standard configuration for the land surface of the North American continent.
There are many ways that historical Landsat data can be used to provide information about forest resources. Among these are a variety of procedures for monitoring changes in the forests, some of which are described here and illustrated for a portion of the Olympic Peninsula of Washington. The illustrations use example products generated for the Consortium for International Earth Science Information Network (CIESIN), an organization whose mission is to facilitate access to and the use and understanding of global change information.
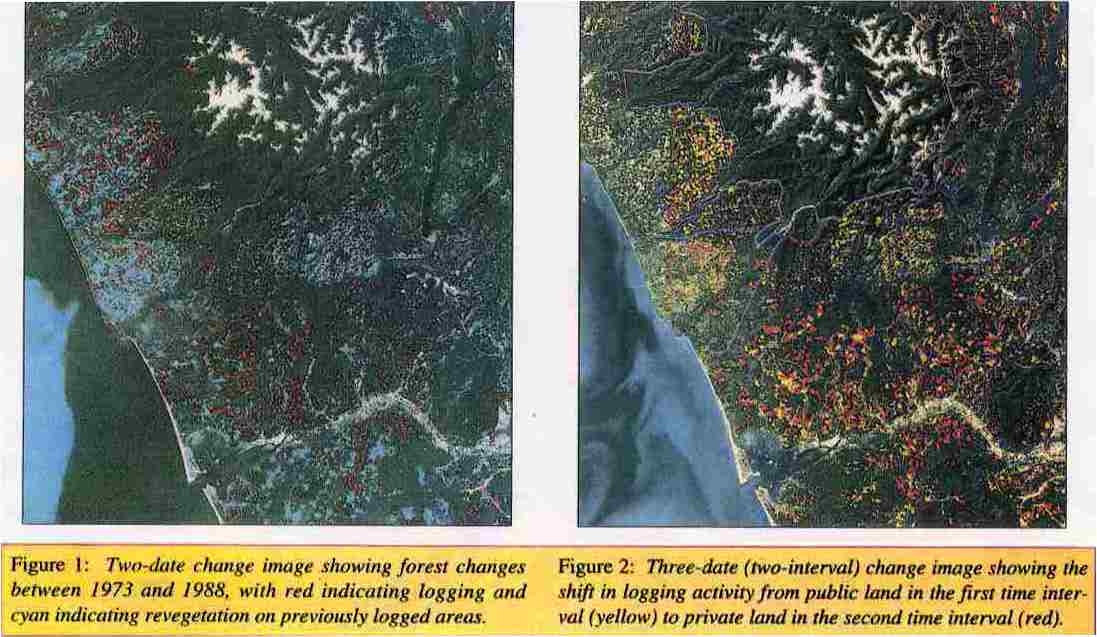
One relatively easy-to-produce product is an image that shows changes that take place between any two selected dates. Figure 1 is an example of such a product, which was produced from a single spectral band of information. In this image, the forest is mainly the dark-toned gray areas, and the Olympic National Forest and Olympic National Park are contained inside the white line (the approximate boundary). Red areas in the forest are areas where logging has occurred in the time interval represented (1973 to 1988). Cyan areas were logged prior to 1973 and have had some regeneration within the time interval.
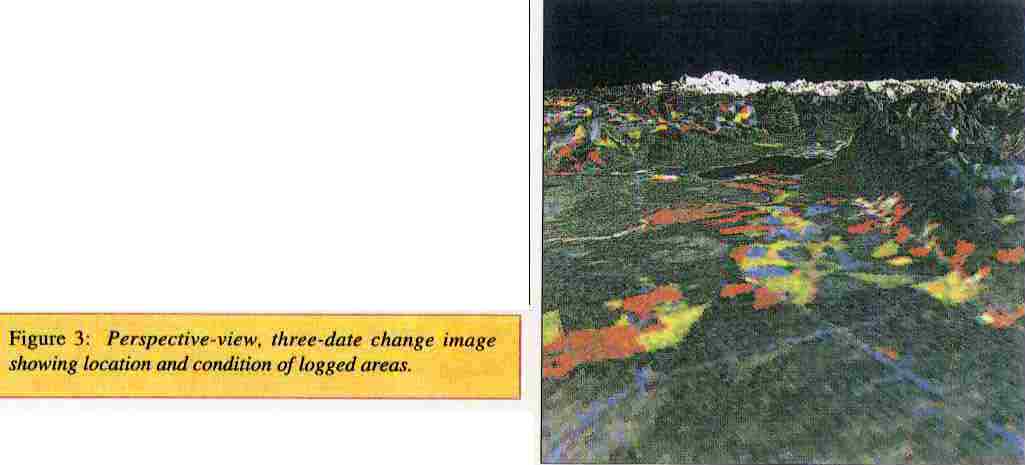
An example of how three dates of Landsat data could be used is shown in Figure 2. This is a three-date (two-interval) change image constructed from Landsat MSS data collected in 1973, 1982, and 1988. The image displays a portion of the Olympic Peninsula of Washington, and was prepared using special-purpose software developed at the Environmental Research Institute of Michigan. A procedure known as change vector analysis was used to generate the change information. A synthetic blue band was also created so that a "natural color" background, which is preferred by some decision makers. could be displayed for context.
This three-date change image shows logging activity that occurred during the first time interval (1973 to 1982) in yellow, and logging activity that occurred during the second time interval (1982 to 1988) in red. Boundaries of various land management units are also shown in color: white indicates national parklands, orange is wilderness, magenta is national forest, blue is state land, cyan is Indian tribal lands, and other areas are private land.
Figure 2 shows both the temporal and spatial pattern of logging activity, and thus is an aid to understanding some of the human-induced change in the forest. Note, for example, that in this area the logging activity has shifted from mainly public land (state and federal) to private land between the two time intervals represented. This shift is due to a variety of factors, perhaps including the decreasing supply of harvestable forest on public land. a decrease in allowable export of logs from public lands, and increasing availability of merchantable .second-growth forest on private land.
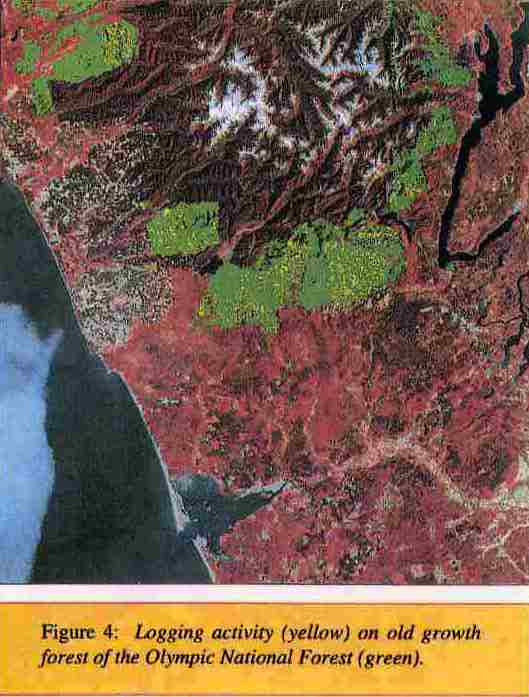
Another form of three-date change image is shown in Figure 3. This is a perspective view change image generated from the three Landsat data sets and digital topographic data. It is useful in that it shows the topography on which logging has occurred, which affects both the difficulty of logging. the success of forest regeneration, and the potential for adverse environmental effects (e.g., soil erosion). In this image. yellow and green depict areas logged between 1973 and 1982 and which now have varying degrees of regrowth. Green areas, which show partial revegetation, tend to be on the flatlands. whereas yellow areas, showing less regrowth, tend to be on the slopes. Blue areas represent cuts prior to 1973 that have regrown, and red areas represent logging that took place after 1982 and which have had little revegetation.
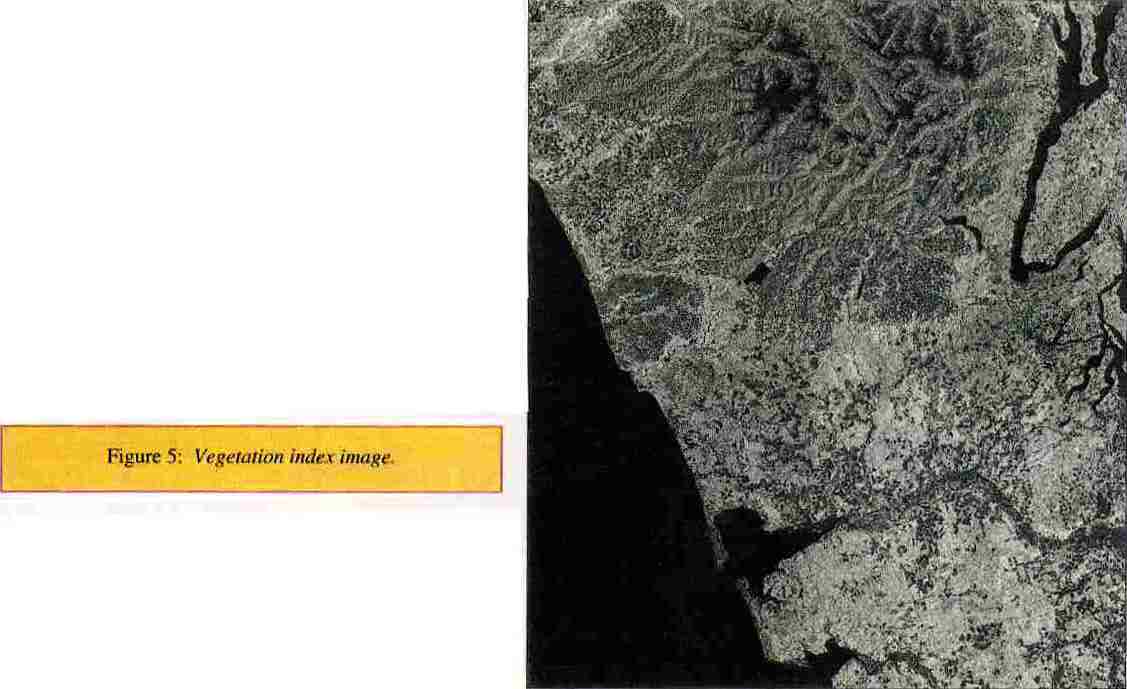
The three dates of Landsat data can be used in other ways, also. For example, all of the logging activity detected during both of the time intervals in Figure 2 was used to prepare Figure 4. Three dates were needed here to make sure that early logging activity (circa 1973) could be distinguished despite the significant regeneration that could occur by 1988 (such as the green areas in Figure 3). Figure 4 shows the logging that has occurred (in yellow) on old growth forest in the Olympic National Forest (the green background). This information is important in assessing logging effects on endangered species habitat, net carbon storage, and other factors of management interest.
Other ways of analysing the condition of the Forests may also prove to be useful. For example, Indicators such as vegetation indices may be developed, which could help monitor forest regeneration and biomass. Vegetation indices are generally formed from combinations of information in two or more spectral channels of data, in the form of ratios, or weighted linear combinations. An example of such an index, where light tone means high values of the index (vegetation leaf area) and dark tones mean small values, is shown in Figure 5. Such indices have been found to be useful in herbaceous vegetation canopies (e.g.. grasslands and agricultural areas), but their interpretation must be vegetation-type specific. Their utility for forest canopies is still being explored.
Undoubtedly, numerous other ways of using historical Landsat data can and will be developed for analysis of forest resources, both locally and globally. Such data, and products that can be produced from them, are a potentially valuable information source for scientists, forest managers, and policymakers, and that potential has only begun to be tapped. In addition, other opportunities will occur in the future, as additional kinds of information from new Earth Observing Satellites become available.
About the Authors:
Dr. Colwell and Mr: Sadowski are research scientists with the Environmental Research Institute of Michigan. Both have been involved in developing improved change detection procedures for use on multidate satellite data sets. Mr. .Sadowski is also a contributor to the Landsat Pathfinder Science Working Group.