 Reproduced, with permission, from:Sabins Jr., F. F. 1987. Remote sensing; principles and interpretation. New York: W. H. Freeman
Digital Image Processing Many types of remote sensing images are routinely recorded in digital form and then processed by computers to produce images for interpreters to study. The simplest form of digital image processing employs a microprocessor that converts the digital data tape into a film image with minimal corrections and calibrations. At the other extreme, large mainframe computers are employed for sophisticated interactive manipulation of the data to produce images in which specific information has been extracted and highlighted.
A number of books have been published on the subject of digital image processing; a representative selection is listed at the end of this chapter. Indeed, more books are available that deal with image processing than with image interpretation, which is ironic because processing is really just a preparatory step for the all-important activity of interpretation.
Digital processing did not originate with remote sensing and is not restricted to these data. Many image-processing techniques were developed in the medical field to process X-ray images and images from sophisticated body-scanning devices. For remote sensing, the initial impetus was the program of unmanned planetary satellites in the 1960s that telemetered, or transmitted, images to ground receiving stations. The low quality of the images required the development of processing techniques to make the images useful. Another impetus was the Landsat program, which began in 1972 and provided repeated worldwide coverage in digital format. A third impetus is the continued development of faster and more powerful computers, peripheral equipment, and software that are suitable for image processing.
This chapter describes and illustrates the major categories of image processing. The publications cited at the end of the chapter describe in detail the methods and the mathematical transformations. The processes are illustrated with Landsat examples because these are the most familiar and are readily available to readers; the digital processes, however, are equally applicable to all forms of digital image data.
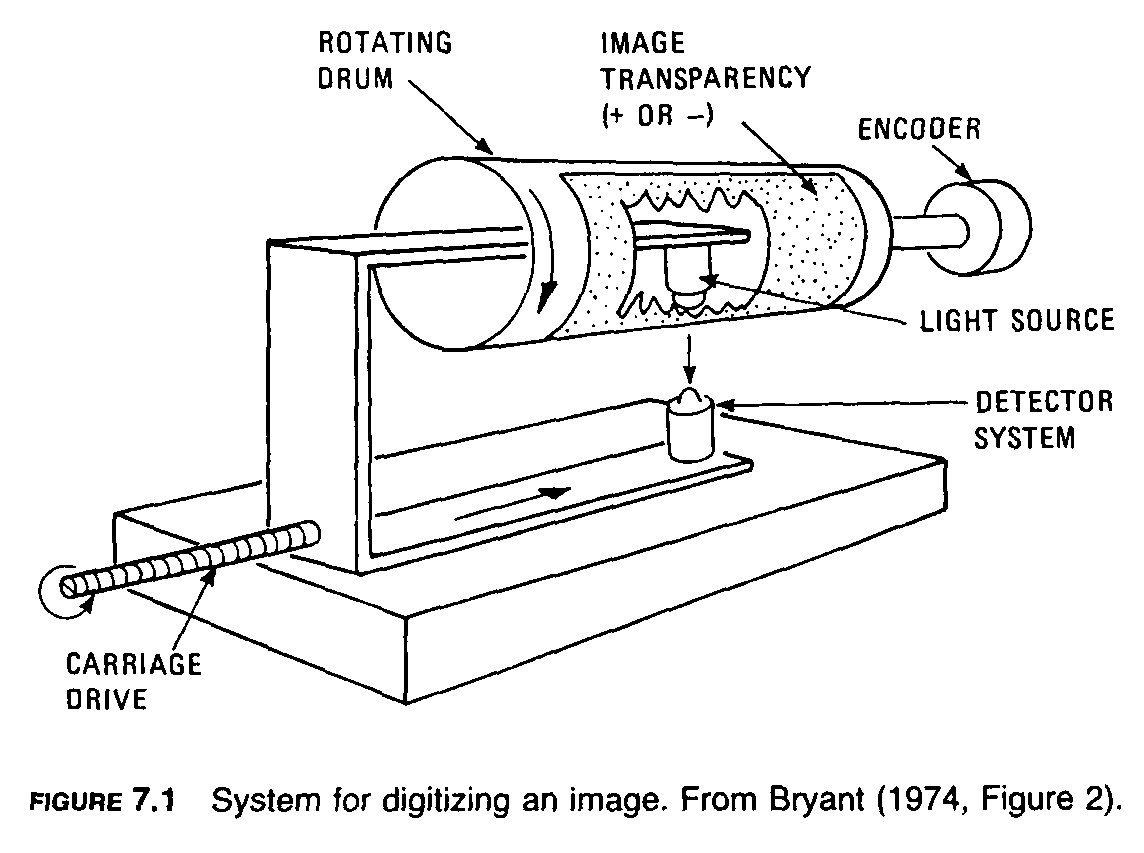
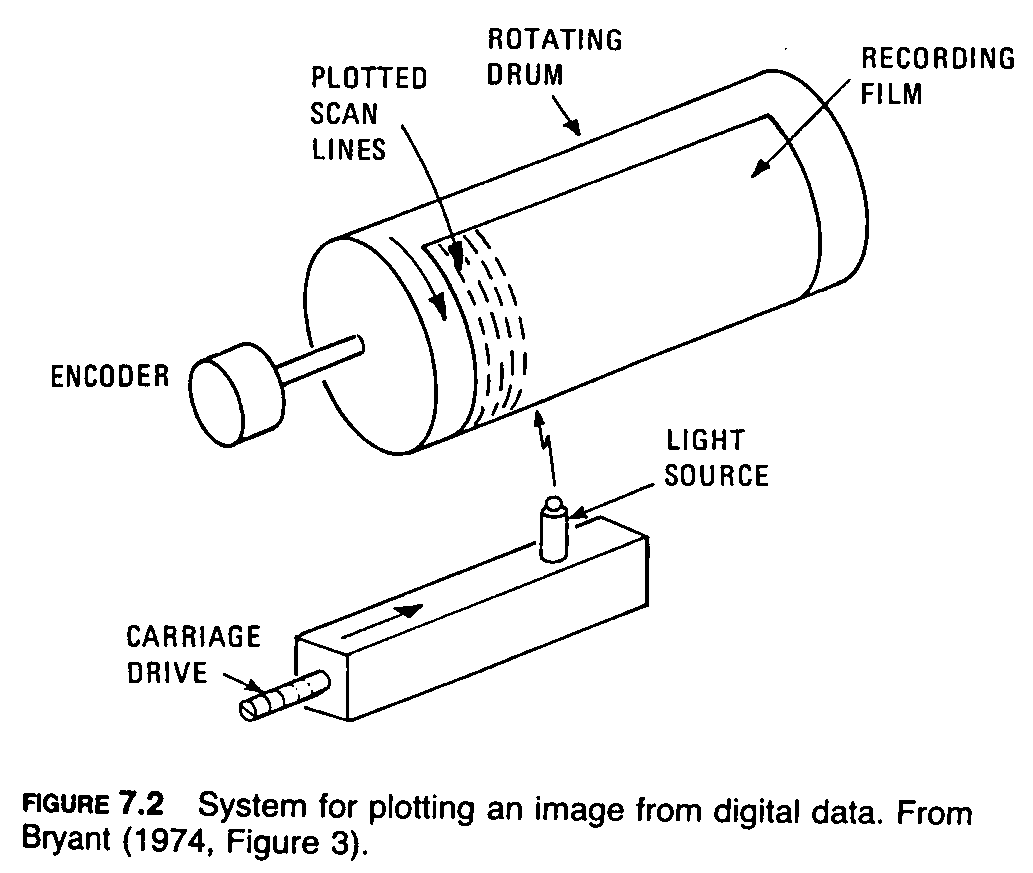
A typical drum digitizing system (Figure 7.1) consists of a rotating cylinder with a fixed shaft and a movable carriage that holds a light source and a detector similar to a photographic light meter. The positive or negative transparency is placed over the opening in the drum, and the carriage is positioned at a corner of the film. As the drum rotates, the detector measures intensity variations of the transmitted light caused by variations in film density. Each revolution of the drum records one scan line of data across the film. At the end of each revolution the encoder signals the drive mechanism, which advances the carriage by the width of one scan line to begin the next revolution.
Width of the scan line is determined by the optical aperture of the detector, which typically is a square opening measuring 50 m on a side. The analog electrical signal of the detector, which varies with film density changes, is sampled at 50
m intervals along the scan line, digitized, and recorded as a DN value on magnetic tape. Each DN is recorded as a series of bits, which form an ordered sequence of ones and zeroes. Each bit represents an exponent of the base 2. An eight-bit series is commonly used to represent 256 values on the gray scale (28 = 256 levels of brightness), with 0 for black and 255 for white. A group of eight bits is called a byte. The film image is thus converted into a regular array of pixels that are referenced by scan line number (y coordinate) and pixel count along each line (x coordinate). A typical 23-by-23-cm (9-by-9-in.) aerial photograph digitized with a 50-
m sampling interval thus converts into 21 million pixels.
The intensity of the digitizer light source is calibrated at the beginning of each scan line to compensate for any fluctuations of the light source. These drum digitizers are fast, efficient, and relatively inexpensive. Color images may be digitized into the values of the component primary colors on three passes through the system using blue, green, and red filters over the detector. A digital record is produced for each primary color, or wavelength band.
In flatbed digitizers, the film is mounted on a flat holder that moves in the x and y directions between a fixed light source and a detector. These devices are usually slower and more expensive than drum digitizers, but they are also more precise. Some systems employ reflected light in order to digitize opaque paper prints. Another digitizing system is the flying-spot scanner, which is essentially a modified television camera; it electronically scans the original image in a raster pattern. The resulting voltage signal for each line is digitized and recorded. Linear-array digitizers are similar to the along-track scanners described in Chapter 1. An optical system projects the image of the original photograph onto the focal plane of the system. A mechanical transport system moves a linear array of detectors across the focal plane to record the original photograph in digital form.
The digitized image is recorded on magnetic tape that can be read into a computer for various processing operations. The processed data are then displayed as an image on a viewing device or plotted onto film as described in the following section.
Flying-spot plotters produce an image with a beam that sweeps in a raster pattern across the recording film. This system is also employed to display images on a television screen, which enables the interpreter to view the processed image in real time rather than to wait for the processed data to be plotted onto film, developed, and printed.
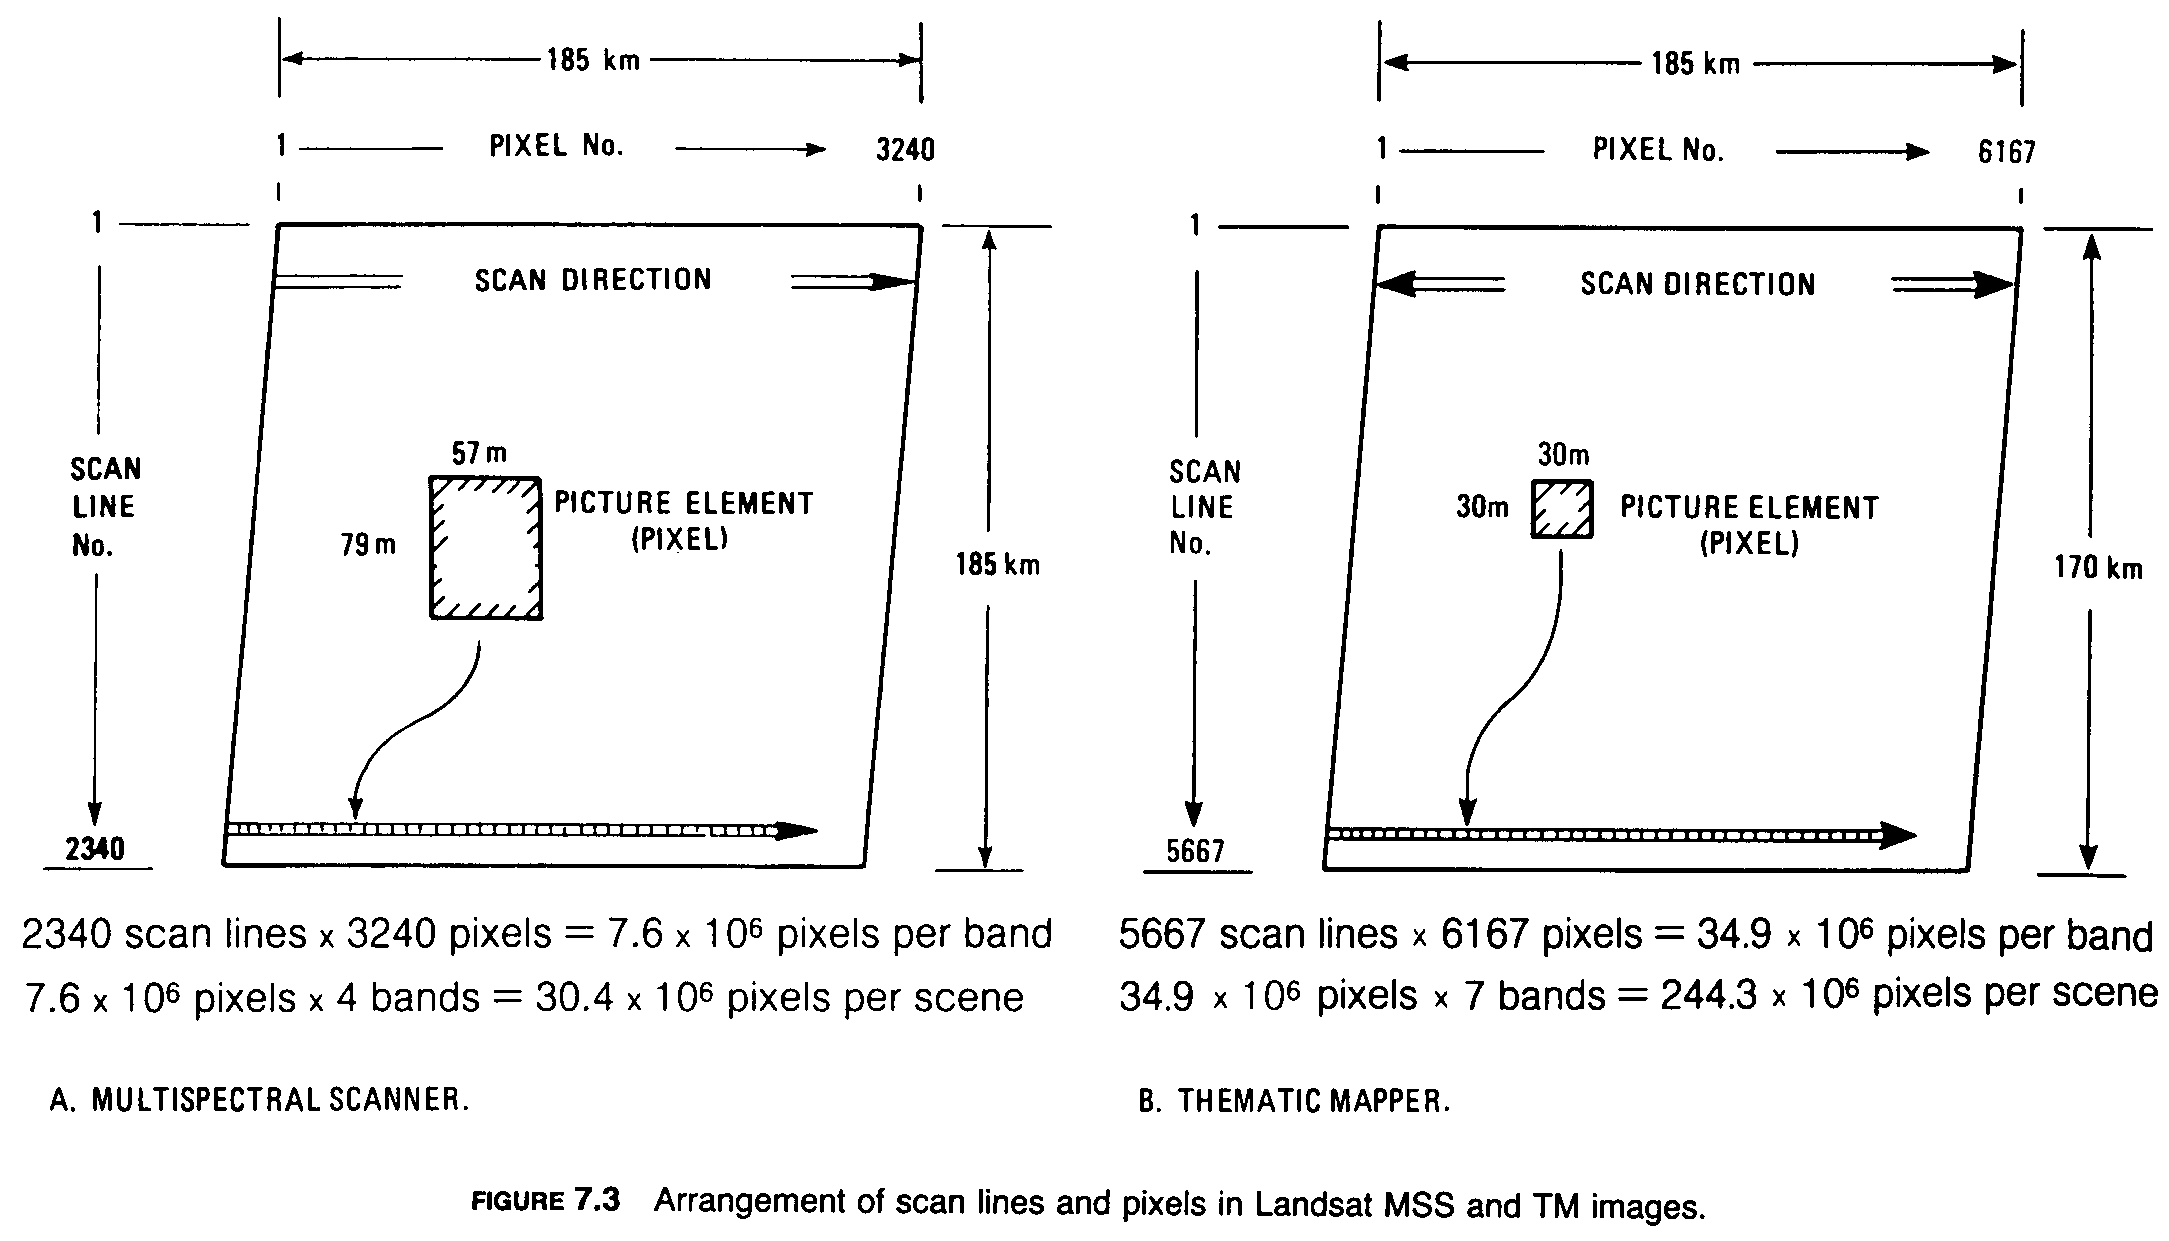
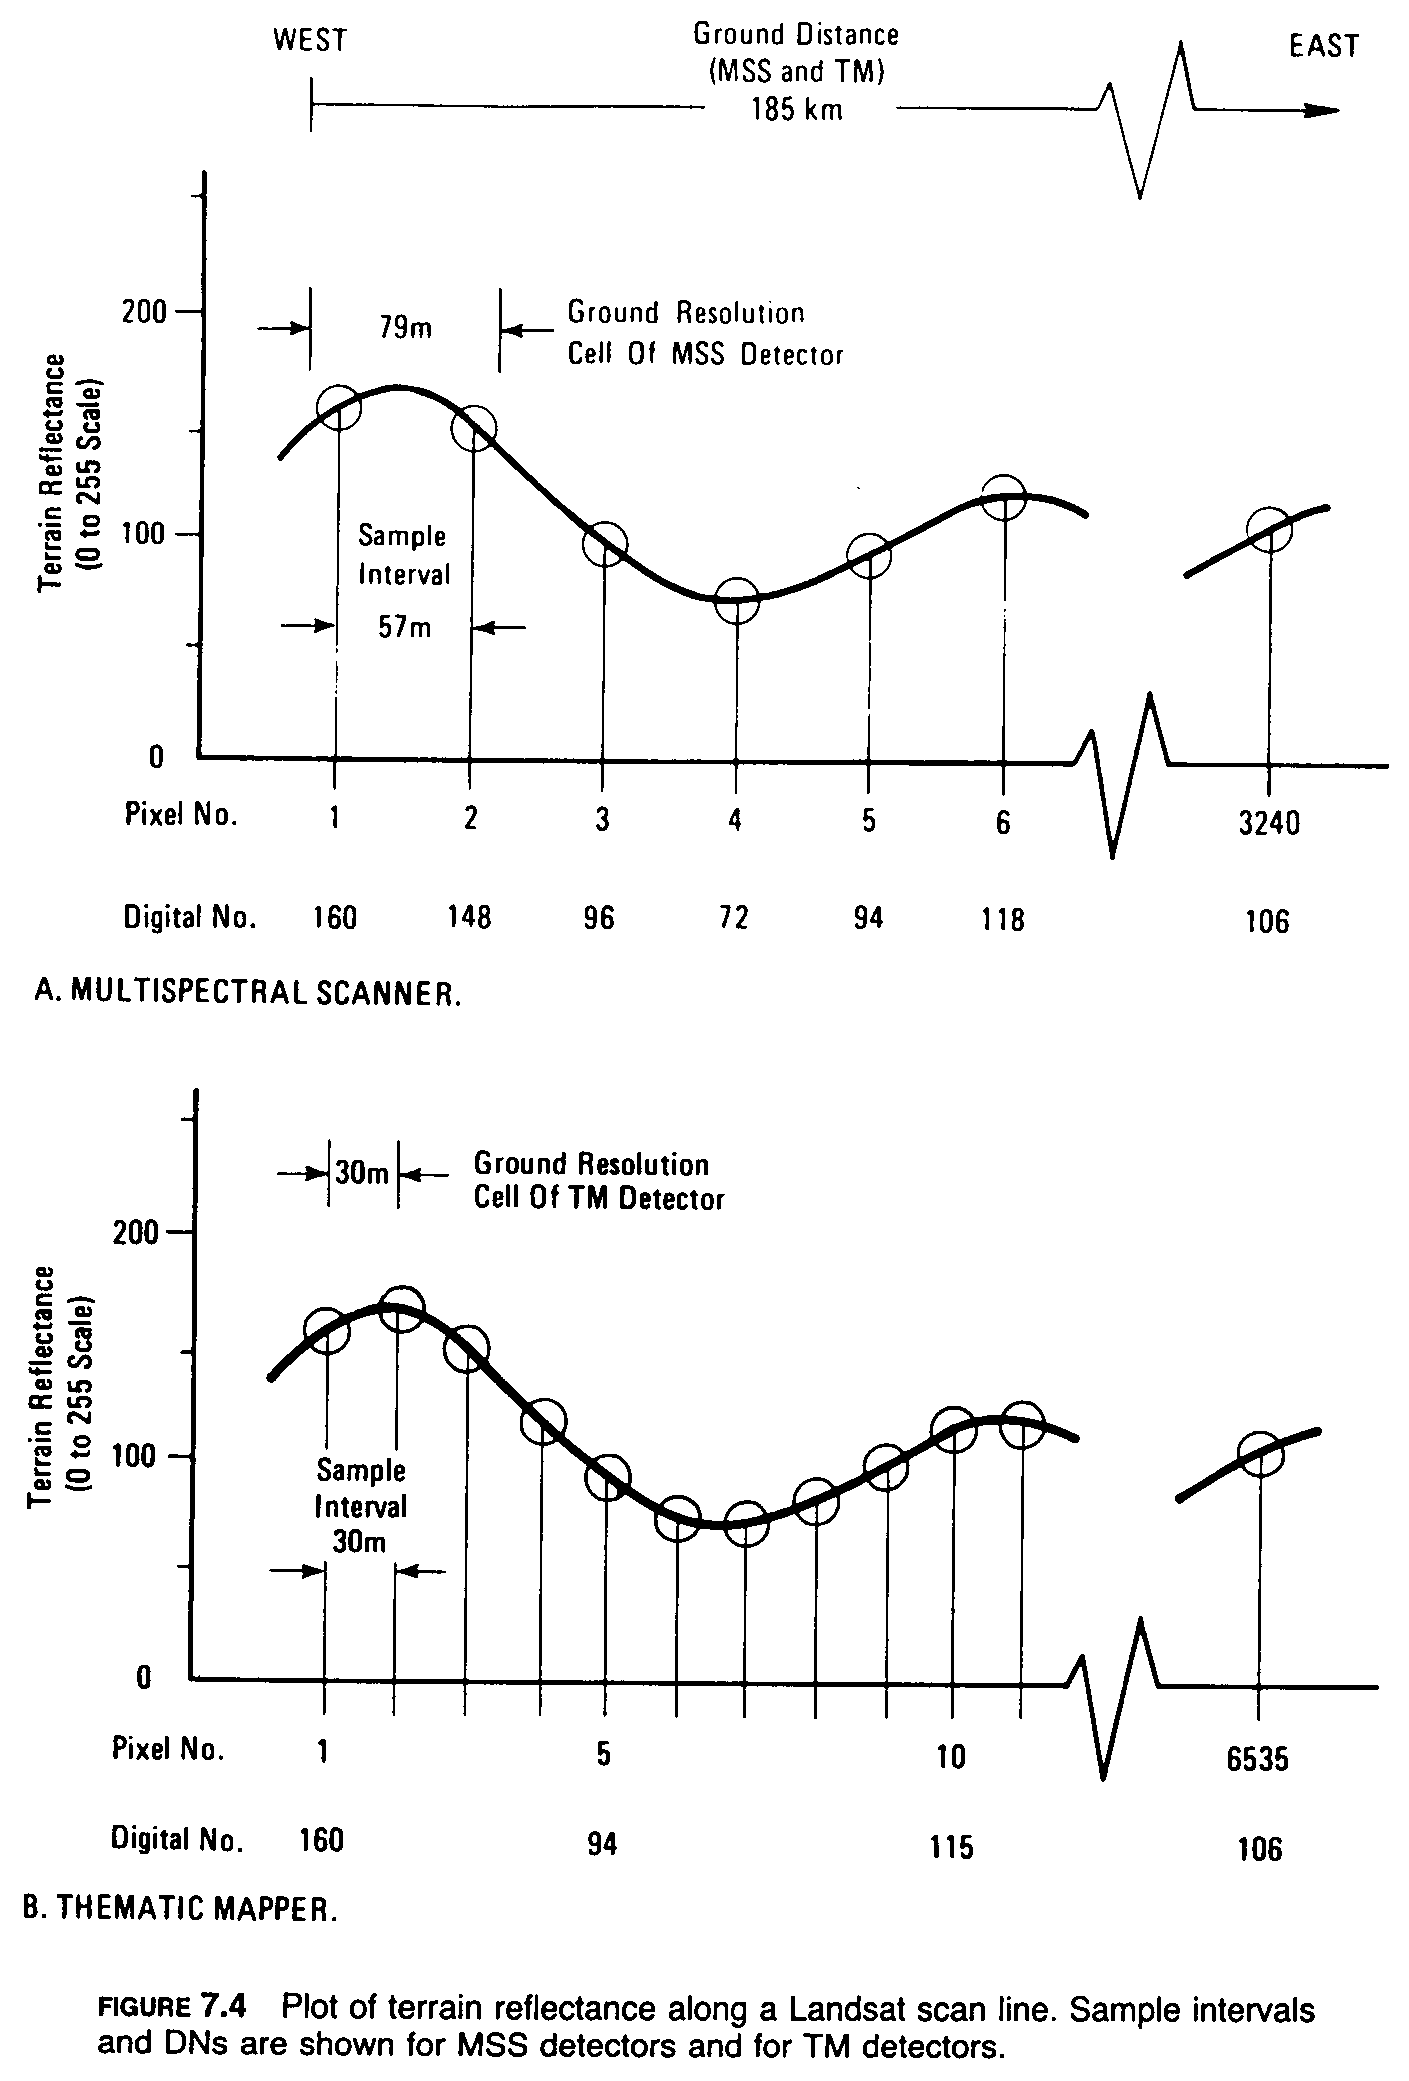
Landsat MSS Data The ground resolution cell of MSS is a 79-by-79-m square. An image consists of 2340 scan lines, each of which is 185 km long in the scan direction and 79 m wide in the orbit direction (Figure 7.3A). During each east-bound sweep of the scanner mirror, reflected solar energy is separated into the four spectral bands and focused onto detectors to generate a response that varies in amplitude proportionally with the intensity of the reflected energy. A segment of an MSS scan line showing variation in terrain reflectance is illustrated in Figure 7.4A together with the 79-m dimension of the ground resolution cell. The curve showing reflectance recorded as a function of distance along the scan line is called an analog display because the curve is a graphic analogy of the property being measured. Digital displays record information as a series of numbers. Analog data are converted into digital data by sampling the analog display at regular intervals and recording the analog value at each sample point in digital form. The optimum interval between sample points is one that records significant features of the analog signal with the minimum number of samples. For MSS the optimum sample interval was determined to be 57 m. Each sample is converted into a DN that is transmitted to ground receiving stations. Thus each scan line consists of 3240 pixels each covering an area measuring 57 by 79 m. For each pixel, four digital numbers are recorded for reflectance, one each in bands 4, 5, 6, and 7. Spatial resolution of the image is ultimately determined by the 79-by-79-m dimensions of the ground resolution cell; the smaller sample interval does not alter this relationship. Brightness values for bands 4, 5, and 6 are recorded on CCTs using a seven-bit scale (27 = 128 values: 0 to 127); band 7 is recorded on a six-bit scale (26 = 64 values: 0 to 63). Most processing systems employ eight-bit scales; bands 4, 5, and 6 are multiplied by 2 and band 7 is multiplied by 4 for conversion to eight-bit scales.
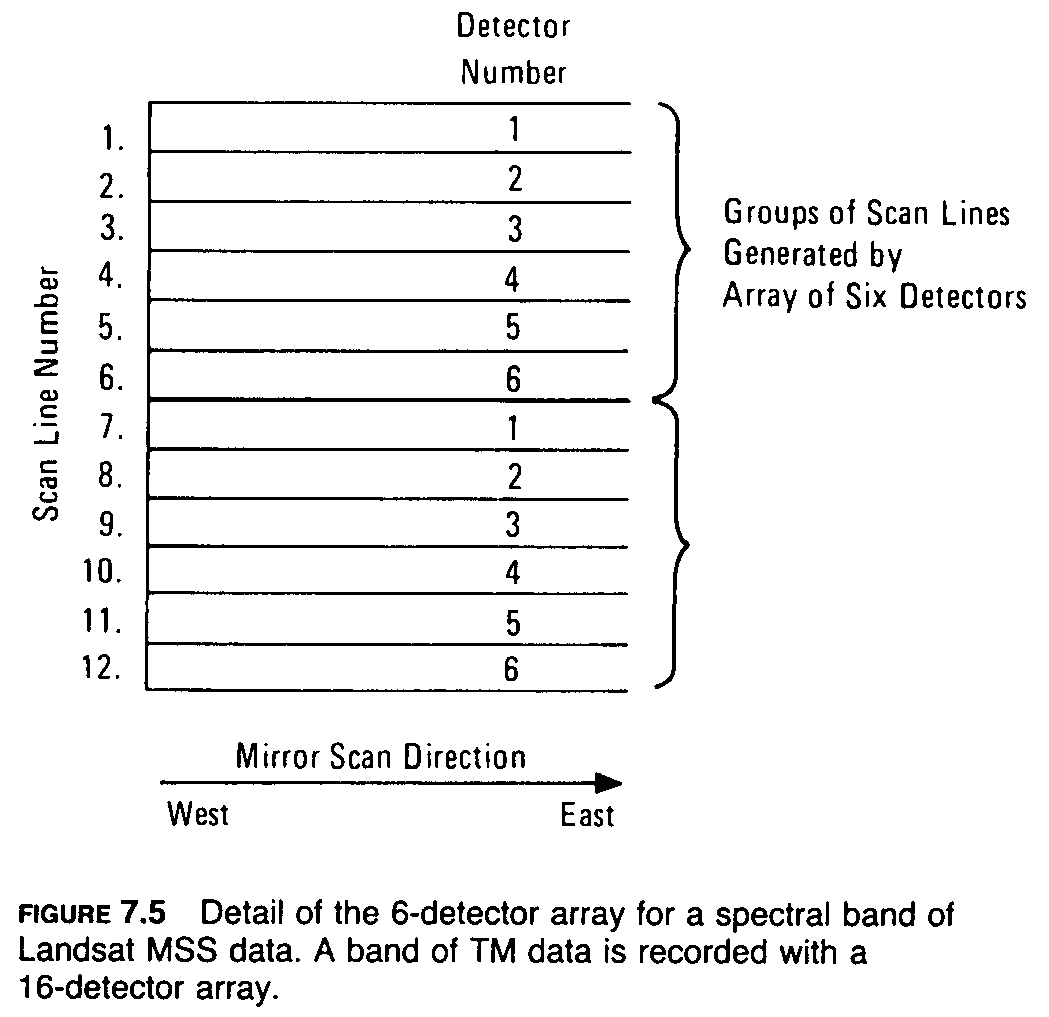
Each sweep of the MSS scan mirror reflects light onto four arrays of six detectors, one array for each spectral band. Thus each mirror sweep records six scan lines for each band (Figure 7.5). The advantage of this design over one using a single detector is that the number of mirror sweeps and the velocity of the mirror scan are reduced by a factor of 6, which results in a longer dwell time and a higher signal-to-noise ratio. A disadvantage is that the response of one detector may differ from that of the other five, causing every sixth scan line to be defective. Digital methods for correcting these image defects are discussed later in this chapter. As mentioned previously, each MSS band consists of 2340 scan lines, each with 3240 pixels, for a total of 7.6 x 106 pixels or 30.4 x 106 pixels for the four bands (Figure 7.3A). Holkenbrink (1978) describes details of the MSS digital format.
Landsat TM Data The ground resolution cell of TM is a 30-by-30-m square. An image consists of 5965 scan lines, each of which is 185 km long in the scan direction and 30 m wide in the orbit direction. The analog signal is sampled at 30-m intervals to produce 30-by-30-m pixels (Figure 7.4B). Each scan line consists of 6167 pixels, and each band consists of 34.9 x 106 pixels (Figure 7.3B). The seven bands have a total of 244.3 x 106 pixels, which is more than eight times the data that is contained in an MSS image. Each of the six TM visible and reflected IR bands employs an array of 16 detectors, and unlike MSS, recording occurs during both sweep directions; together these factors allow adequate dwell time for the TM's relatively small ground resolution cells. Because of the lower energy flux radiated in the thermal IR region, band 6 (10.5 to 12.5 m) is recorded by only four detectors, each with a 120-by-120-m ground resolution cell. The cells are resampled into 30-by-30-m pixels to be consistent with the other bands. TM data are recorded on an eight-bit scale, which provides a greater dynamic range than the lower bit scales of MSS. Bernstein and others (1984) have analyzed the performance of the TM system; NASA (1983) gives details of the CCT format for TM data.
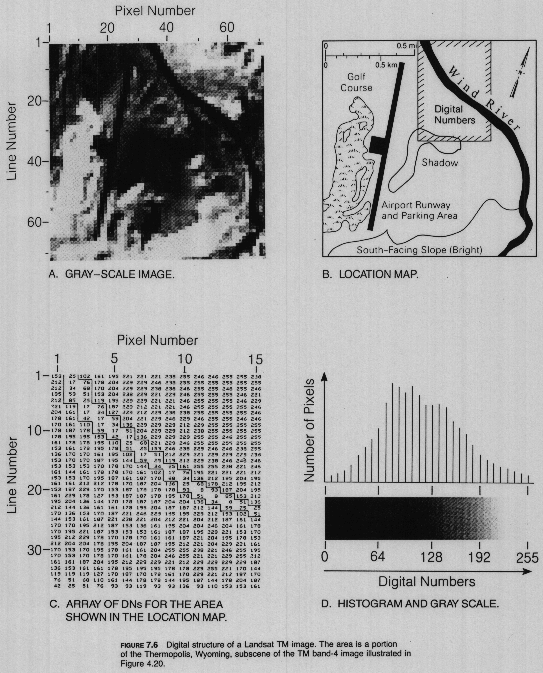
Structure of Landsat Digital Images The structure of a TM digital image is illustrated in Figure 7.6, which is a greatly enlarged portion of band 4 from the Thermopolis, Wyoming, subscene (Figure 4.20D). Figure 7.6A shows an array of 66 by 66 pixels, and Figure 7.6B is a map that shows the location for the printout of DNs in Figure 7.6C. The correlation of the image gray scale to the eight-bit DN scale is shown in Figure 7.6D, where a DN of 0 is displayed as black and 255 as white. Referring again to the printout, note the low values associated with the Wind River and the high values of the adjacent vegetated flood plains. These values are consistent with the strong absorption by water and strong reflection by vegetation of the IR energy recorded by TM band 4. In the river, note that the lowest digital numbers (DN = 8 to 17) correspond to the center of the stream; pixels along the stream margin have higher values (DN = 20 to 80). The 30-by-30-m ground resolution cells in the center of the river are wholly occupied by water, whereas marginal cells are occupied partly by water and partly by vegetation resulting in a DN intermediate between water and vegetation. These mixed pixels may also be observed in the gray-scale image (Figure 7.6A). A useful method of displaying statistics of an image is the histogram (Figure 7.6D), in which the vertical scale records the number of pixels associated with each DN, shown on horizontal scale. This discussion deals with TM data, but MSS data have a similar format.
Availability of Landsat Digital Data Landsat CCTs of the world are available from EOSAT at a cost of $660 for an MSS scene and $3300 for a TM scene. Many of the Landsat distribution centers listed in Chapter 4 can provide CCTs for their area of coverage.
Another restoration method plots a histogram of DNs for each of the six detectors. Deviations in mean and median values for the histograms are used to recognize and determine corrections for detector differences.
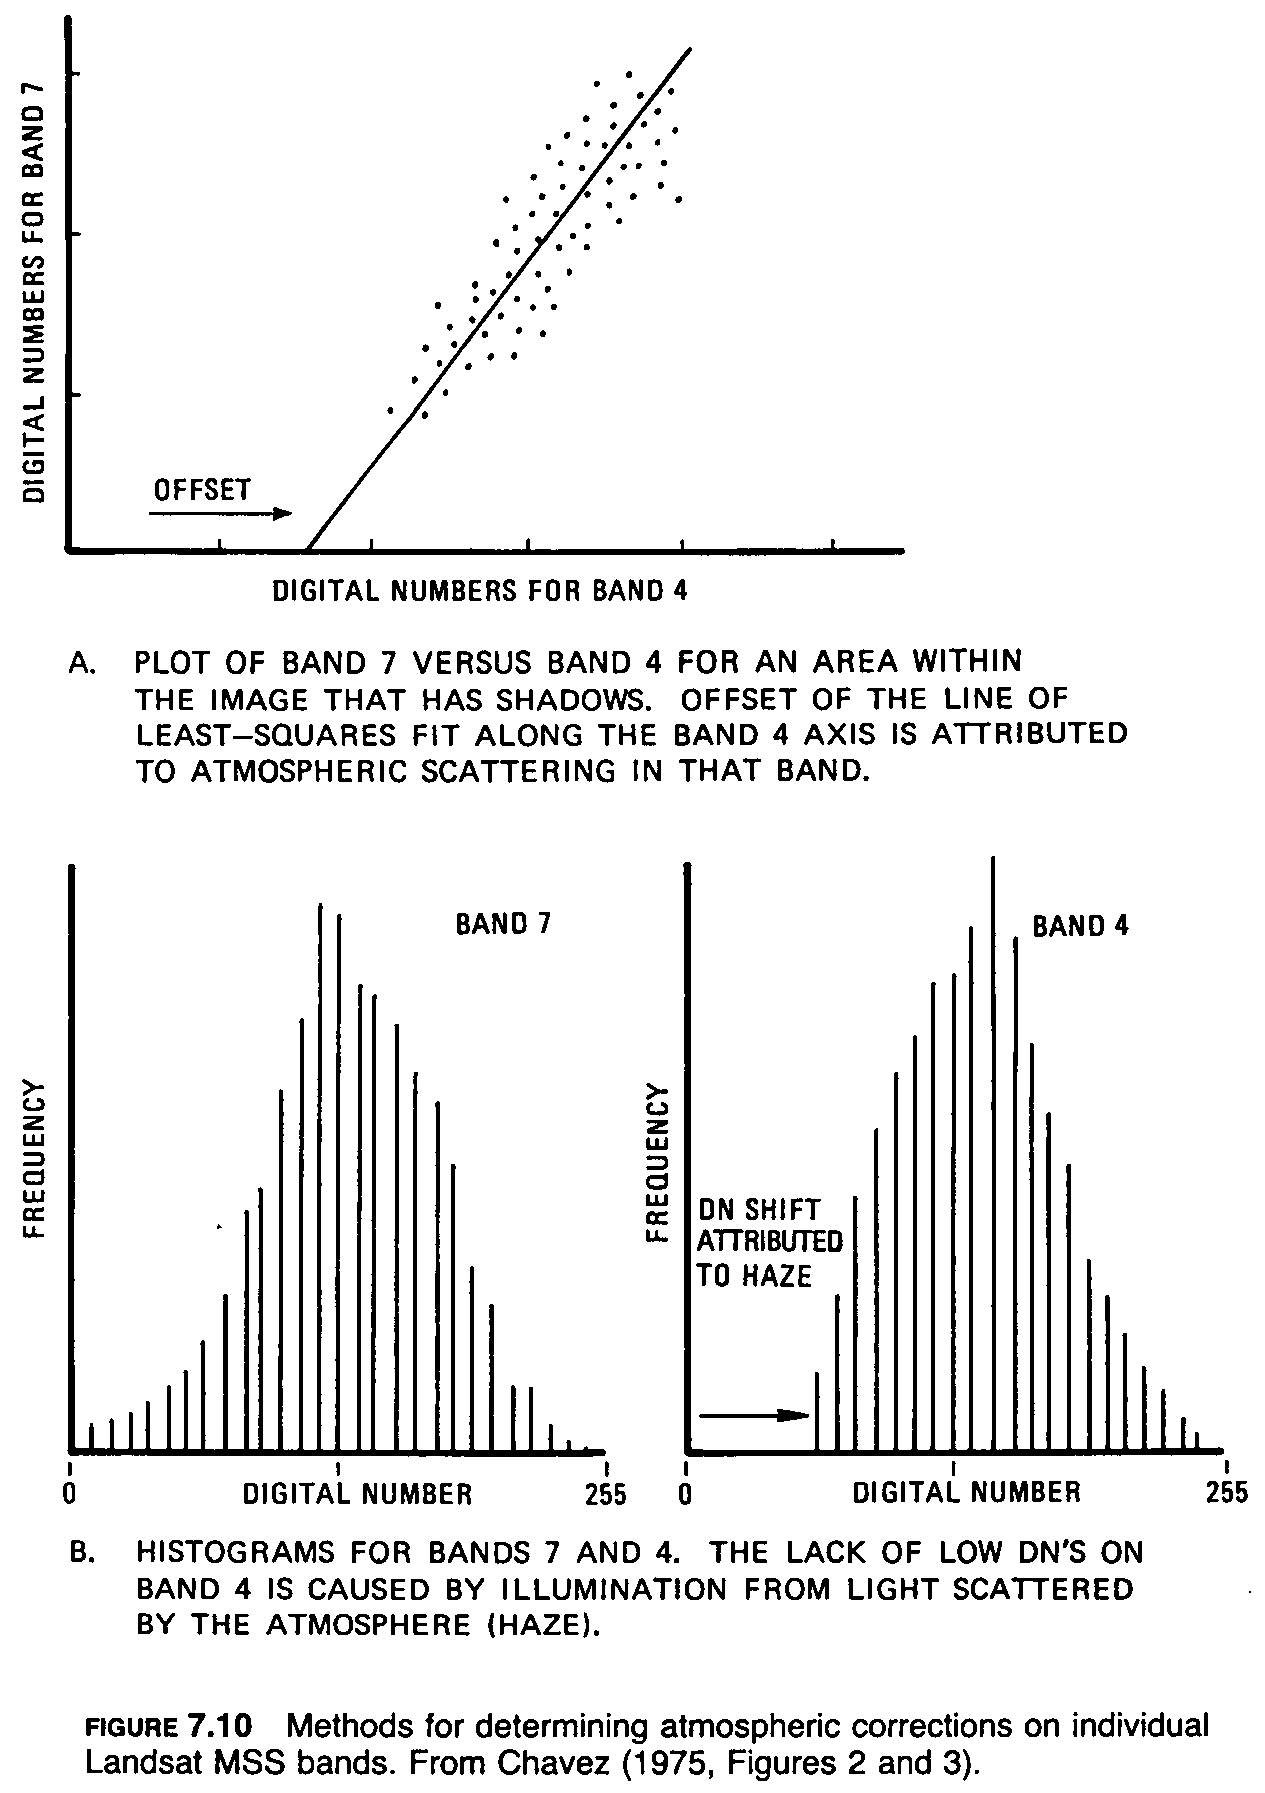
The second restoration technique also requires that the image have some dense shadows or other areas of zero reflectance on band 7. The histogram of band 7 in Figure 7.10B shows some values of 0. The histogram of band 4 lacks zero values, and the peak is offset toward higher DNs because of the additive effect of the haze. Band 4 also shows a characteristic abrupt increase in the number of pixels on the low end of the DN scale (left side of the histogram). The lack of DNs below this threshold is attributed to illumination from light scattered into the sensor by the atmosphere. For band 4 this threshold typically occurs at a DN of 11; this value is subtracted from all the band 4 pixels to correct for haze. For band 5 the correction is generally a DN of 7 and for band 6 a DN of 3. There can be a problem with this correction technique if the Landsat scene lacks dense shadows and if there are no band-7 pixels with DNs of 0.
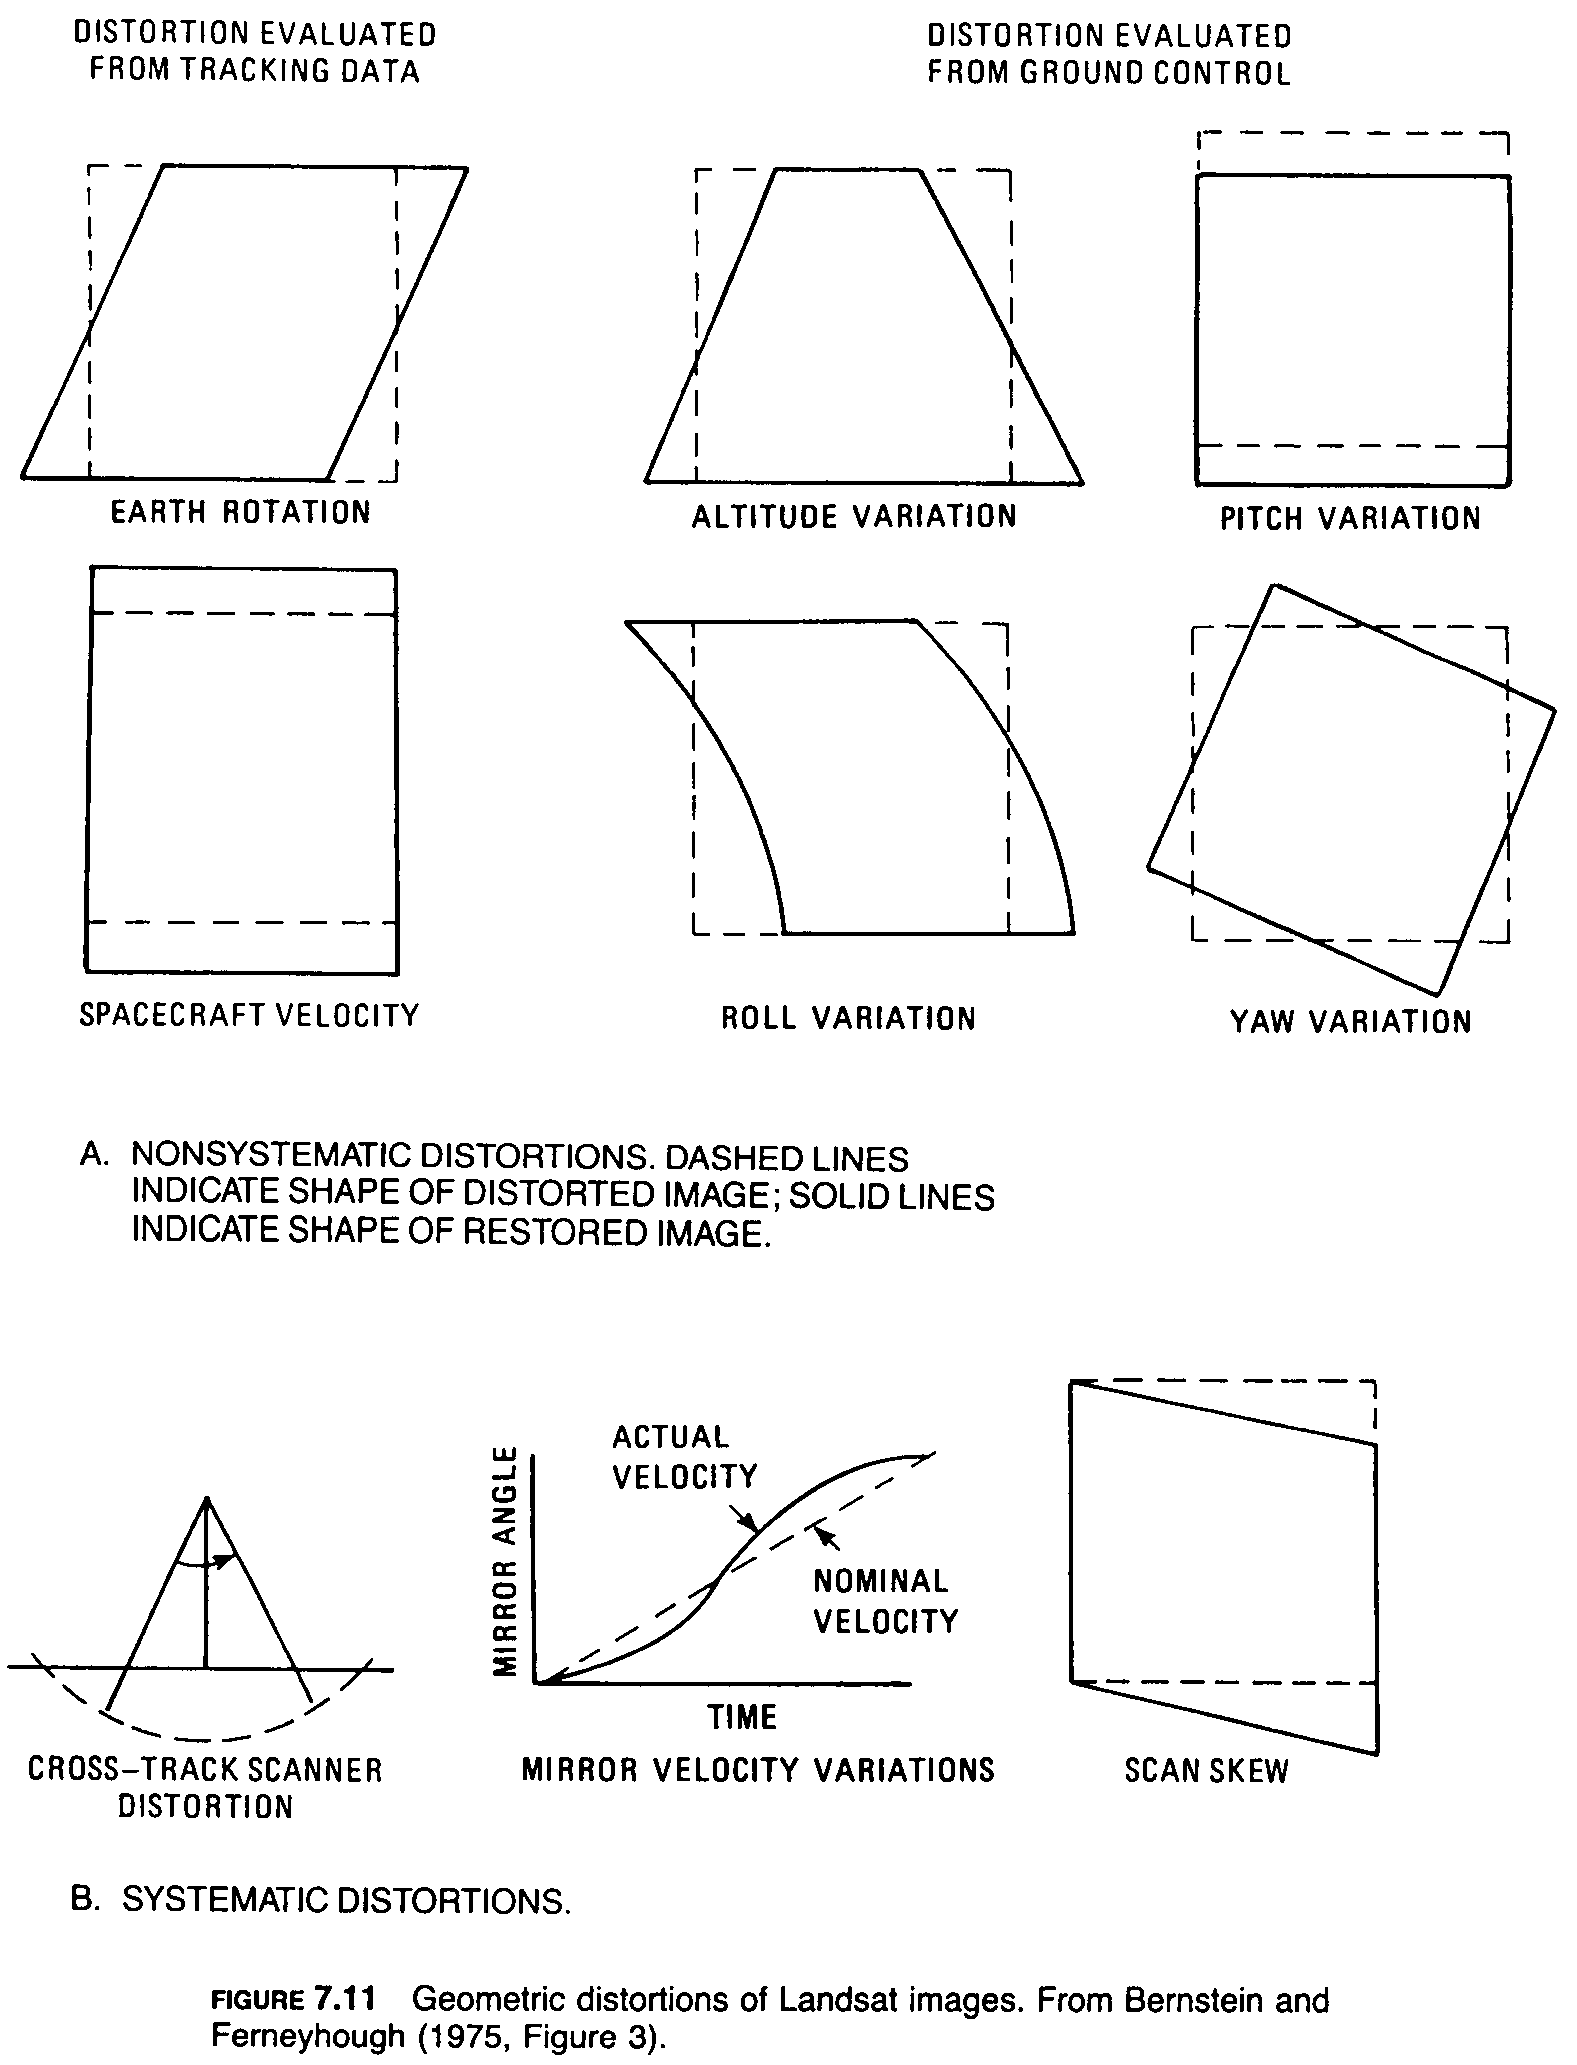
Nonsystematic Distortions Nonsystematic distortions (Figure 7.11A) are not constant because they result from variations in the spacecraft attitude, velocity, and altitude and therefore are not predictable. These distortions must be evaluated from Landsat tracking data or ground-control information. Variations in spacecraft velocity cause distortion in the along-track direction only and are known functions of velocity that can be obtained from tracking data.
The amount of earth rotation during the 28 sec required to scan an image results in distortion in the scan direction that is a function of spacecraft latitude and orbit. In the correction process, successive groups of scan lines (6 for MSS, 16 for TM) are offset toward the west to compensate for earth rotation, resulting in the parallelogram outline of the image.
Variations in attitude (roll, pitch, and yaw) and altitude of the spacecraft cause nonsystematic distortions that must be determined for each image in order to be corrected. The correction process employs geographic features on the image, called ground control points (GCPs), whose positions are known. Intersections of major streams, highways, and airport runways are typical GCPs. Differences between actual GCP locations and their positions in the image are used to determine the geometric transformations required to restore the image. The original pixels are resampled to match the correct geometric coordinates. The various resampling methods are described by Rifman (1973), Goetz and others (1975), and Bernstein and Ferneyhough (1975).
Systematic Distortions Geometric distortions whose effects are constant and can be predicted in advance are called systematic distortions. Scan skew, cross-track distortion, and variations in scanner mirror velocity belong to this category (Figure 7.11B). Cross-track distortion results from sampling of data along the MSS scan line at regular time intervals that correspond to spatial intervals of 57 m. The length of the ground interval is actually proportional to the tangent of the scan angle and therefore is greater at either margin of the scan line. The resulting marginal compression of Landsat images is identical to that described for airborne thermal IR scanner images (Chapter 5); however, distortion is minimal in Landsat images because the scan angle is only 5.8 deg on either side of vertical in contrast to the 45 deg to 60 deg angles of airborne cross-track scanners.
Tests before Landsat was launched determined that the velocity of the MSS mirror would not be constant from start to finish of each scan line, resulting in minor systematic distortion along each scan line. The known mirror velocity variations may be used to correct for this effect. Similar corrections are employed for TM images.
Scan skew is caused by the forward motion of the spacecraft during the time required for each mirror sweep. The ground swath scanned is not normal to the ground track but is slightly skewed, producing distortion across the scan line. The known velocity of the satellite is used to restore this geometric distortion.
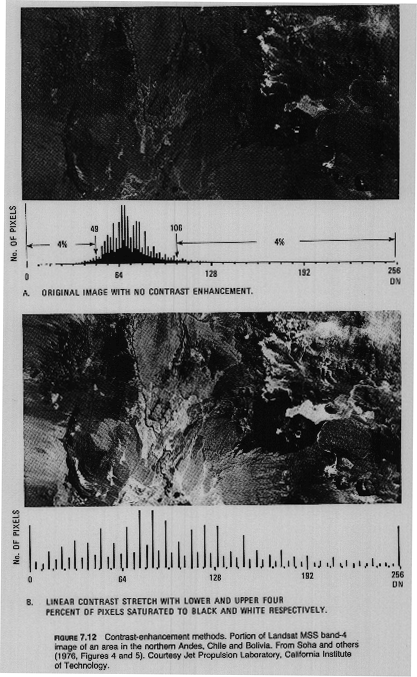
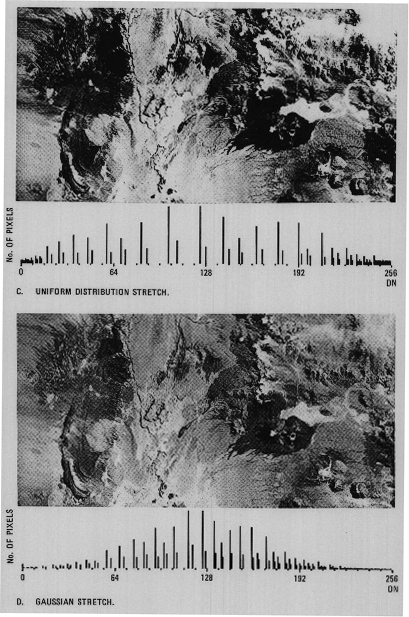
The sensitivity range of Landsat TM and MSS detectors was designed to record a wide range of terrain brightness from black basalt plateaus to white sea ice under a wide range of lighting conditions. Few individual scenes have a brightness range that utilizes the full sensitivity range of the MSS and TM detectors. To produce an image with the optimum contrast ratio, it is important to utilize the entire brightness range of the display medium, which is generally film. Figure 7.12A is a portion of an MSS band-4 image of the Andes along the Chile-Bolivia border that was produced directly from the CCT data with no modification of original DNs. The accompanying histogram shows the number of pixels that correspond to each DN. The central 92 percent of the histogram has a range of DNs from 49 to 106, which utilizes only 23 percent of the available brightness range [(106 - 49)/256 = 22.3%]. This limited range of brightness values accounts for the low contrast ratio of the original image. Three of the most useful methods of contrast enhancement are described in the following sections.
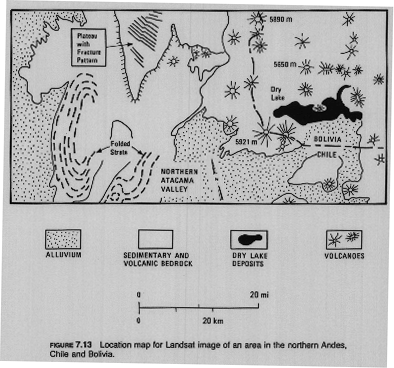
Linear Contrast Stretch The simplest contrast enhancement is called a linear contrast stretch (Figure 7.12B). A DN value in the low end of the original histogram is assigned to extreme black, and a value at the high end is assigned to extreme white. In this example the lower 4 percent of the pixels (DN < 49) are assigned to black, or DN = 0, and the upper 4 percent (DN > 106) are assigned to white, or DN = 255. The remaining pixel values are distributed linearly between these extremes, as shown in the enhanced image and histogram of Figure 7.12B. The map of Figure 7.13 is useful in locating features for comparison on the images. The improved contrast ratio of the image with linear contrast stretch is particularly evident in the enhancement of individual rock units in the area of folded strata west of the Atacama Valley. Northwest-trending fractures occur in the plateau in the north-central portion of the area (Figure 7.13). The fractures are visible on the stretched image but are obscure on the original image. Most of the Landsat images in this book have been linearly stretched. For color images, the individual bands were stretched before being combined in color.
The linear contrast stretch greatly improves the contrast of most of the original brightness values, but there is a loss of contrast at the extreme high and low end of DN values. In the northeast portion of the original image (Figure 7.12A), the lower limits of snow caps on volcanoes are clearly defined. On the stretched image (Figure 7.12B), however, the white tone includes both the snow and the alluvium lower on the flanks of the mountains. In the small dry lake north of the border, patterns that are visible on the original image are absent on the stretched image. Brightness differences within the dry lake and between the snow and alluvium were in the range of DNs greater than 106. On the stretched image, all these DNs are now white, as shown on the histogram (Figure 7.12B) by the spike at a DN of 255. A similar effect occurs at the low end of the DN range. On the original image, some individual dark lava flows are differentiated in the vicinity of the 5921-m volcano (see Figure 7.13 for location), but all of the flows are black on the stretched image because all DNs less than 49 are now black. In comparison to the overall contrast improvement in Figure 7.12B, these contrast losses at the brightness extremes are acceptable unless one is specifically interested in these elements of the scene.
Because of the flexibility of digital methods, an investigator could, for example, cause all DNs less than 106 to become black (0) and then linearly stretch the remaining high DNs greater than 105 through a range from 1 through 255. This extreme stretch would enhance the contrast differences within the bright pixels at the expense of the remainder of the scene. For the original Andes image (Figure 7.12A), 4 and 96 percent happened to be the optimum dark and bright limits; for the other MSS bands of this scene and for other images, different limits may be optimum and can be determined by inspection of the original histograms.
Nonlinear Contrast Stretch Nonlinear contrast enhancement is also possible. Figure 7.12C illustrates a uniform distribution stretch (or histogram equalization) in which the original histogram has been redistributed to produce a uniform population density of pixels along the horizontal DN axis. This stretch applies the greatest contrast enhancement to the most populated range of brightness values in the original image. In Figure 7.12C the middle range of brightness values are preferentially stretched, which results in maximum contrast in the alluvial deposits around the flanks of the mountains. The northwest-trending fracture pattern is also more strongly enhanced by this stretch. As both histogram and image show, the uniform distribution stretch strongly saturates brightness values at the sparsely populated light and dark tails of the original histogram. The resulting loss of contrast in the light and dark ranges is similar to that in the linear contrast stretch but not as severe.
A Gaussian stretch (Figure 7.12D) is a nonlinear stretch that enhances contrast within the tails of the histogram. This stretch fits the original histogram to a normal distribution curve between the 0 and 255 limits, which improves contrast in the light and dark ranges of the image. The different lava flows are distinguished, and some details within the dry lake are emphasized. This enhancement occurs at the expense of contrast in the middle gray range; the fracture pattern and some of the folds are suppressed in this image.
An important step in the process of contrast enhancement is for the user to inspect the original histogram and determine the elements of the scene that are of greatest interest. The user then chooses the optimum stretch for his needs. Experienced operators of image processing systems bypass the histogram examination stage and adjust the brightness and contrast of images that are displayed on a CRT. For some scenes a variety of stretched images are required to display fully the original data. It also bears repeating that contrast enhancement should not be done until other processing is completed, because the stretching distorts the original values of the pixels.
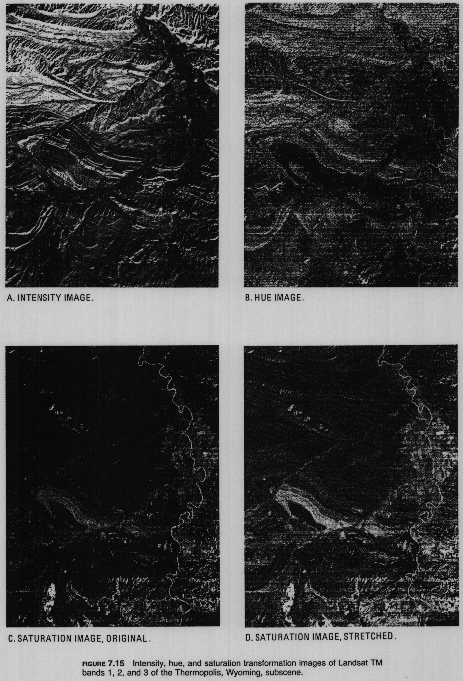
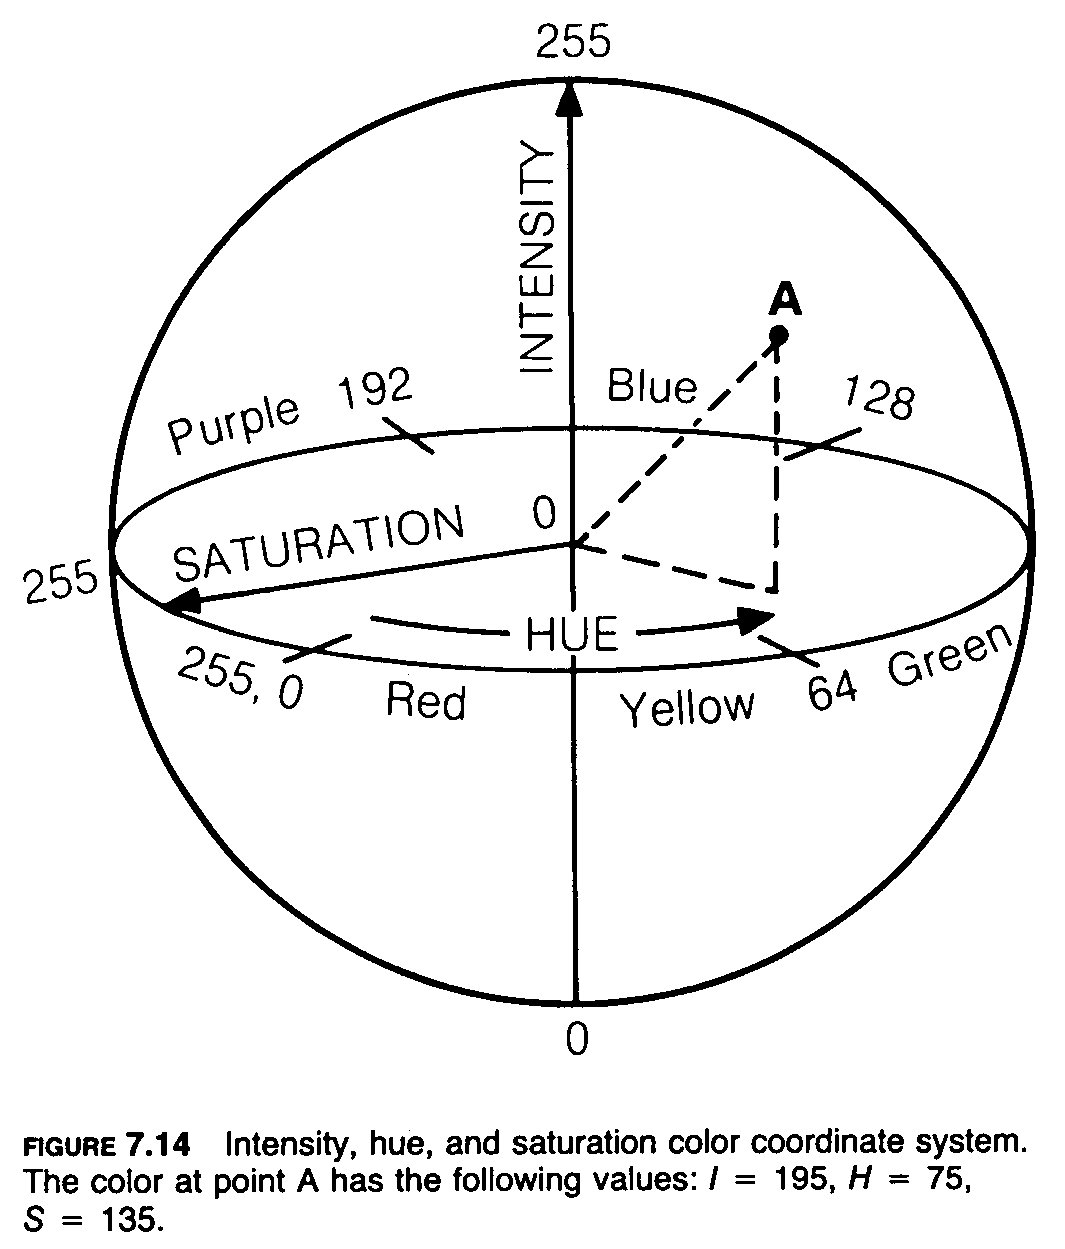
When any three spectral bands of MSS or TM data are combined in the RGB system, the resulting color images typically lack saturation, even though the bands have been contrast-stretched. Plate 10A is an RGB normal color image prepared from TM bands 3, 2, and 1 of the Thermopolis, Wyoming, subscene that was described in Chapter 4. The individual bands were linearly stretched, but the color image has the pastel appearance that is typical of many Landsat images. The undersaturation is due to the high degree of correlation between spectral bands. High reflectance values in the green band, for example, are accompanied by high values in the blue and red bands, so pure colors are not produced. To correct this problem, a method of enhancing saturation was developed that consists of the following steps:
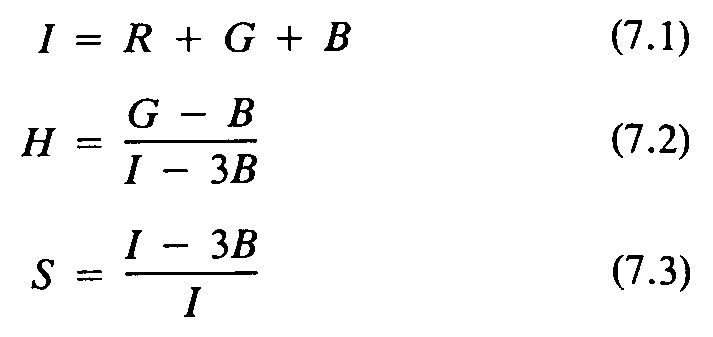
for the interval 0 < H < 1, extended to 1 < H < 3. After enhancing the saturation image, the IHS values are converted back into RGB images by inverse equations.
The IHS transformation and its inverse are also useful for combining images of different types. For example, a digital radar image could be geometrically registered to the Thermopolis TM data. After the TM bands are transformed into IHS values, the radar image data may be substituted for the intensity image. The new combination (radar, hue, and enhanced saturation) can then be transformed back into an RGB image that incorporates both radar and TM data.
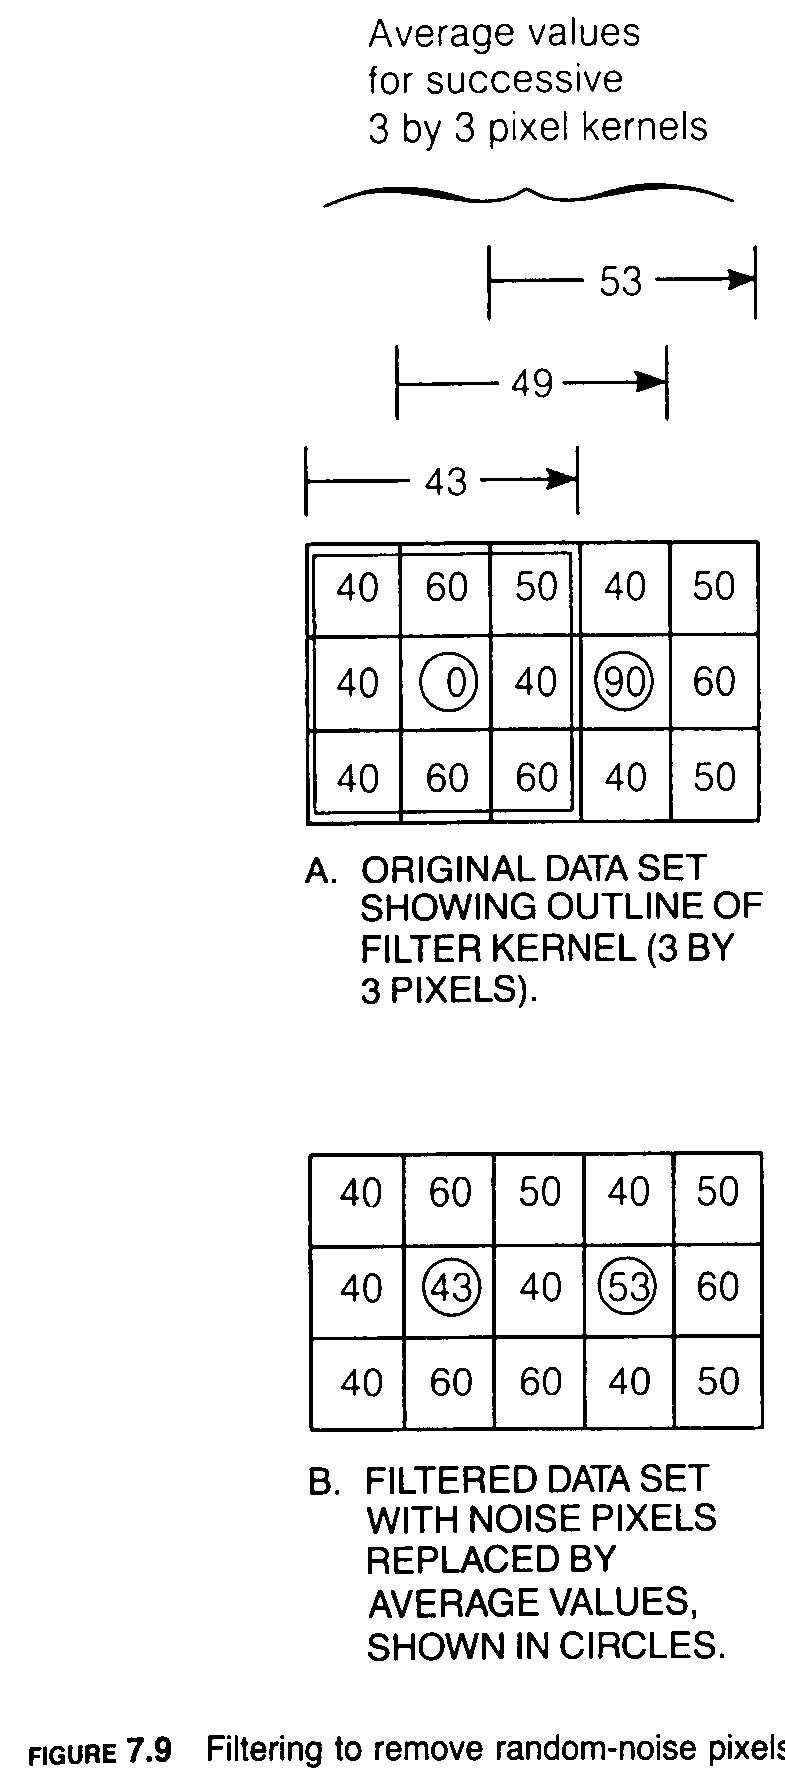
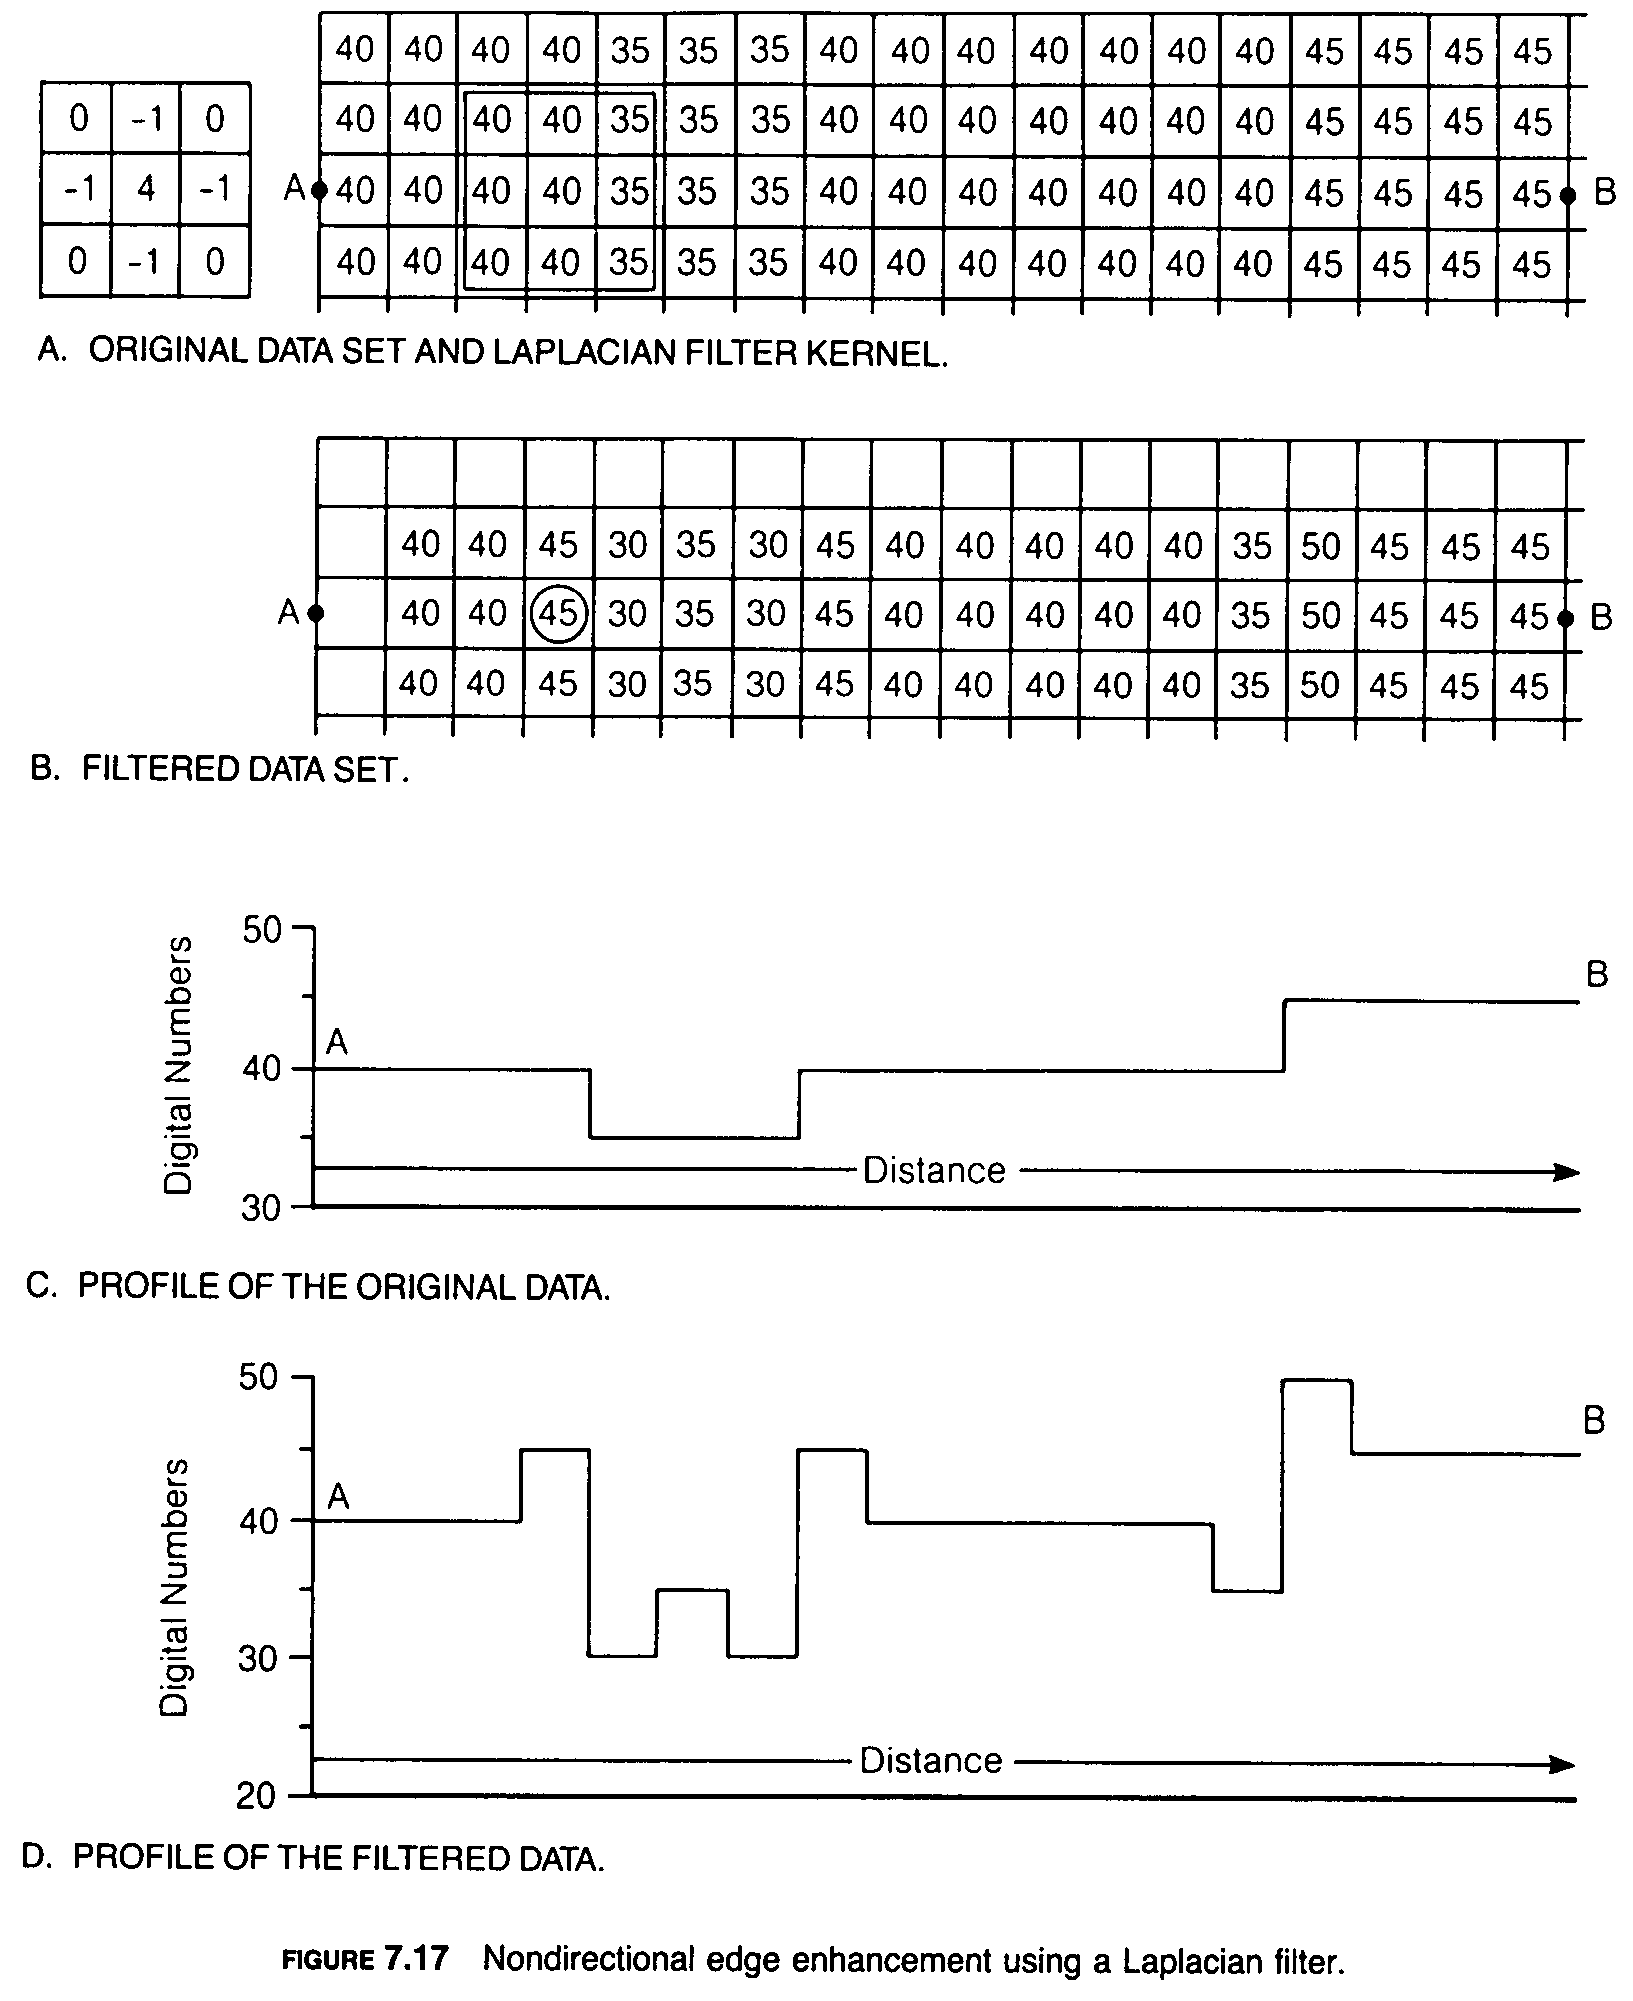
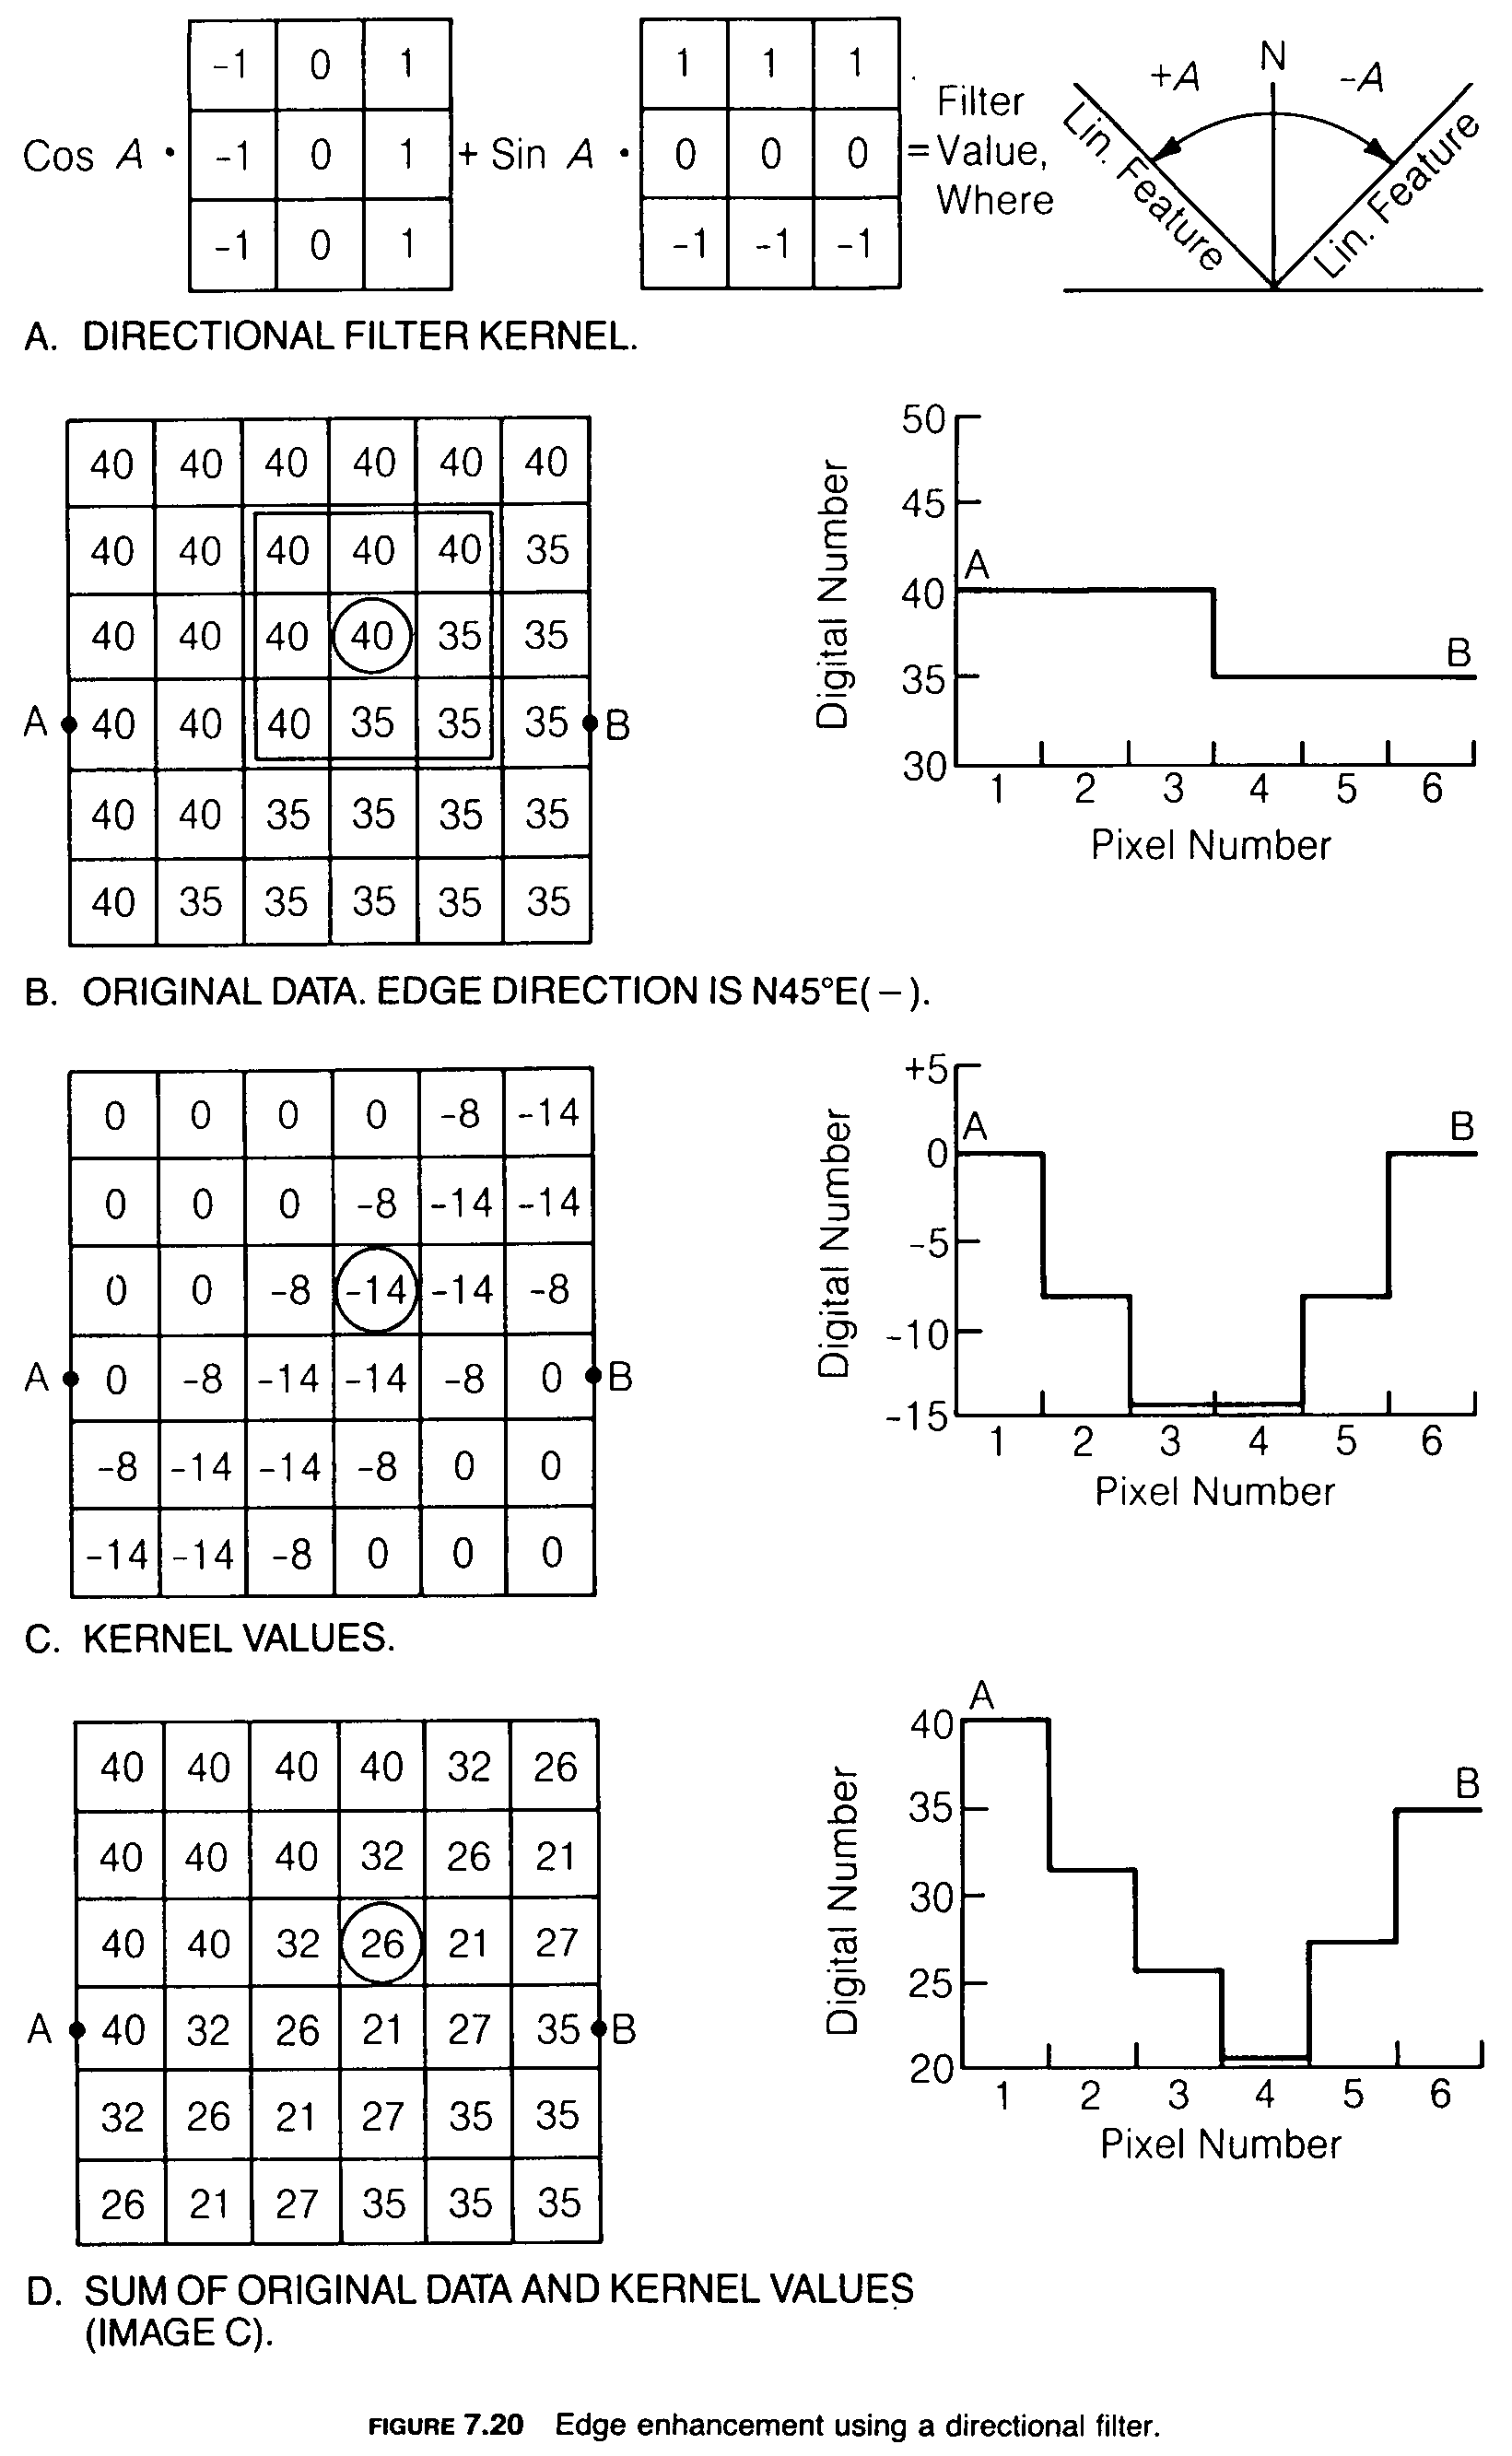
Nondirectional Filters Laplacian filters are nondirectional filters because they enhance linear features having almost any orientation in an image. The exception applies to linear features oriented parallel with the direction of filter movement; these features are not enhanced. A typical Laplacian filter (Figure 7.17A) is a kernel with a high central value, 0 at each corner, and -1 at the center of each edge. The Laplacian kernel is placed over a three-by-three array of original pixels (Figure 7.17A), and each pixel is multiplied by the corresponding value in the kernel. The nine resulting values (four of which are 0 and four are negative numbers) are summed. The resulting value for the filter kernel is combined with the central pixel of the three-by-three data array, and this new number replaces the original DN of the central pixel. For example, the Laplacian kernel is placed over the array of three-by-three original pixels indicated by the box in Figure 7.17A. When the multiplication and summation are performed, the value for the filter kernel is 5. The central pixel in the original array (DN = 40) is combined with the filter value to produce the new value of 45, which is used in the filtered data set (Figure 7.17B). The kernel moves one column of pixels to the right, and the process repeats until the kernel reaches the right margin of the pixel array. The kernel then shifts back to the left margin, drops down one line of pixels, and continues the same process. The result is the data set of filtered pixels shown in Figure 7.17B. In this filtered data set, the outermost column and line of pixels are blank because they cannot form central pixels in an array.
The effect of the edge-enhancement operation can be evaluated by comparing profiles A-B of the original and the filtered data (Figure 7.17C,D). The original data set has a regional background value of 40 that is intersected by a darker, north-trending lineament that is three pixels wide and has DN values of 35. The contrast ratio, between the lineament and background, as calculated from Equation 1.3 is 40/35, or 1.14. In the enhanced profile, the contrast ratio is 45/30, or 1.50, which is a major enhancement. In addition the image of the original lineament, which was three pixels wide, has been widened to five pixels in the filtered version, which further enhances its appearance.
In the eastern portion of the original data set (Figure 7.17A), the background values (40) change to values of 45 along a north-trending linear contact. In an image, this contact would be a subtle tonal lineament between brighter and darker surfaces. The original contrast ratio (45/40 = 1.13) is enhanced by 27 percent in the filtered image (50/35 = 1.43). After the value of the filter kernel has been calculated and prior to combining it with the original central data pixel, the calculated value may be multiplied by a weighting factor. The factor weight may be less than 1 or greater than 1 in order to diminish or to accentuate the effect of the filter. The weighted filter value is then combined with the central original pixel to produce the enhanced image.
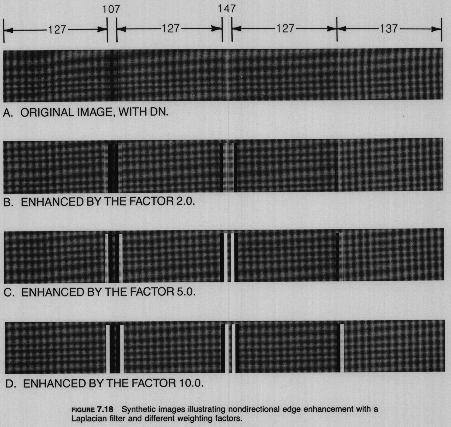
Figure 7.18A is a computer-generated synthetic image with a uniform background (DN = 127). The left portion of the image is crossed by a darker lineament (DN = 107). The central portion is crossed by a brighter lineament (DN = 147). In the right portion of the image, a tonal lineament is formed where the background becomes somewhat brighter (DN = 137). These three linear features have subtle expressions in the original image. The dark lineament and the tonal lineament of the synthetic image are similar to the features in the digital pixel arrays of Figure 7.17A. The Laplacian filter of Figure 7.17A was applied to the synthetic image (Figure 7.18A), and the calculated kernel value was multiplied by a factor of 2.0 to produce the enhanced image in Figure 7.18B; a factor of 5.0 was used to produce Figure 7.18C; a factor of 10.0 was used for Figure 7.18D, which saturates the brightest values to a DN of 255 and the darkest to a DN of 0. The filter has significantly improved the expression of the original lineaments in Figure 7.18A.
Having described the design and operation of a filter for nondirectional edge enhancement, the next step is to apply the filter to a real image. Figure 7.19A is a portion of a Landsat MSS image of an area in Chile. As shown by the map (Figure 7.19F), the central portion of the image is a plateau capped by a layer of resistant rocks that is cut by two sets of fractures. The set that is more abundant and better expressed in the original image trends northwest. A second, less abundant set with a weaker expression trends north. The nondirectional Laplacian filter kernel of Figure 7.17A was applied to the original Landsat image with a factor of 0.8, and the enhanced image is shown in Figure 7.19B. In comparing the original image and the enhanced image, the following features are significant:
The filter is demonstrated by applying it to the array of nine pixels shown by the box over the original data set (Figure 7.20B). The sequence of operations is as follows:
The directional filter of Figure 7.20 was applied to the Landsat image of Figure 7.19A. In the first case the angle of the features to be enhanced was specified as N55 deg W, (angle A = +55 deg) the direction of the northwest-trending fractures (Figure 7.19F). The resulting kernel values (Figure 7.20C) are shown in the image of Figure 7.19C. An alternate way to express this operation is to say that the filter has passed through the data in a direction normal to the specified lineament direction. In this case the filter direction is S35 deg W. In addition to enhancing features oriented normal to this direction of movement, the filter also enhances linear features that trend obliquely to the direction of filter movement. As a result, many additional edges of diverse orientations are enhanced in Figure 7.19C. The filter values of Figure 7.19C are combined with the original data (Figure 7.19A) to produce the enhanced image of (Figure 7.19E. The directionality of the filter may also be demonstrated by passing the filter in a direction parallel with a linear trend. The filter values in (Figure 7.19D were produced by using an orientation of N35\'a1E for angle A. The effect is to move the filter in a direction N55 deg W, which is parallel with the direction of the major fractures. As a result these fractures appear subdued in (Figure 7.19D, whereas north- and northeast-trending features are strongly enhanced.
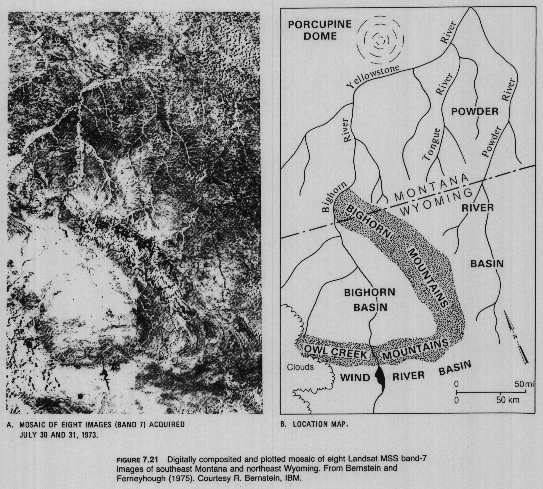
Adjacent images are geometrically registered to each other by recognizing ground control points (GCPs) in the regions of overlap. Pixels are then geometrically adjusted to match the desired map projection. The next step is to eliminate from the digital file the duplicate pixels within the areas of overlap. Optimum contrast stretching is then applied to all the pixels, producing a uniform appearance throughout the mosaic. Figure 7.21A is a digital mosaic prepared in this manner from eight MSS band-7 images covering the portions of southeast Montana and adjacent Wyoming shown on the location map (Figure 7.21B). Note the excellent geometric agreement between adjacent images. The eastern strip was imaged on July 30 and the western strip on July 31, 1973. The only tonal mismatches in the mosaic result from changes in cloud pattern and illumination levels on the two days. Bernstein and Ferneyhough (1975) repeated the registration procedure for bands 4 and 5 of the eight images and composited them with band 7 to produce an IR color mosaic of the area (not shown).
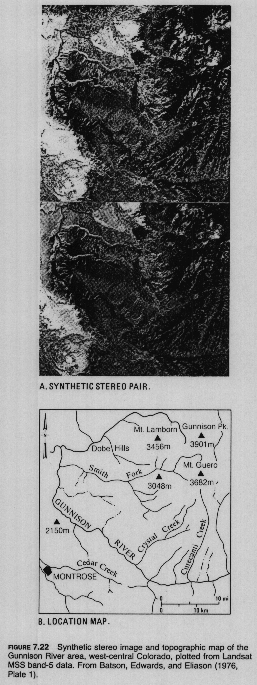
This form of enhancement is illustrated in Figure 7.22, which covers the Gunnison River area in west-central Colorado. Elevation data from a topographic map were digitized with 79-by-79-m pixels that were registered to the MSS image using GCPs. The process described above was used to produce the pair of synthetic stereo images in Figure 7.22A. View the images with a stereoscope to appreciate the three-dimensional effect and vertical exaggeration. Compare the stereo model with the map (Figure 7.22B) to evaluate the topographic features of the area.
A synthetic stereo model is superior to a model from side-lapping portions of adjacent Landsat images because (1) the vertical exaggeration can be increased and (2) the entire image may be viewed stereoscopically. Two disadvantages of computer images are that they are expensive and that a digitized topographic map must be available for elevation control.
Simpson and others (1980) employed a version of this method to combine Landsat images with aeromagnetic maps (in which the contour values represent the magnetic properties of rocks). The digitized magnetic data are registered to the Landsat band so that each Landsat pixel has an associated magnetic value. The stereoscopic transformation is then used to produce a stereo pair of Landsat images in which magnetic values determine the vertical relief in the stereo model. Elevated areas represent high magnetic values and depressions represent low magnetic values. The stereo model enables the interpreter to compare directly the magnetic and visual signatures of the rocks.
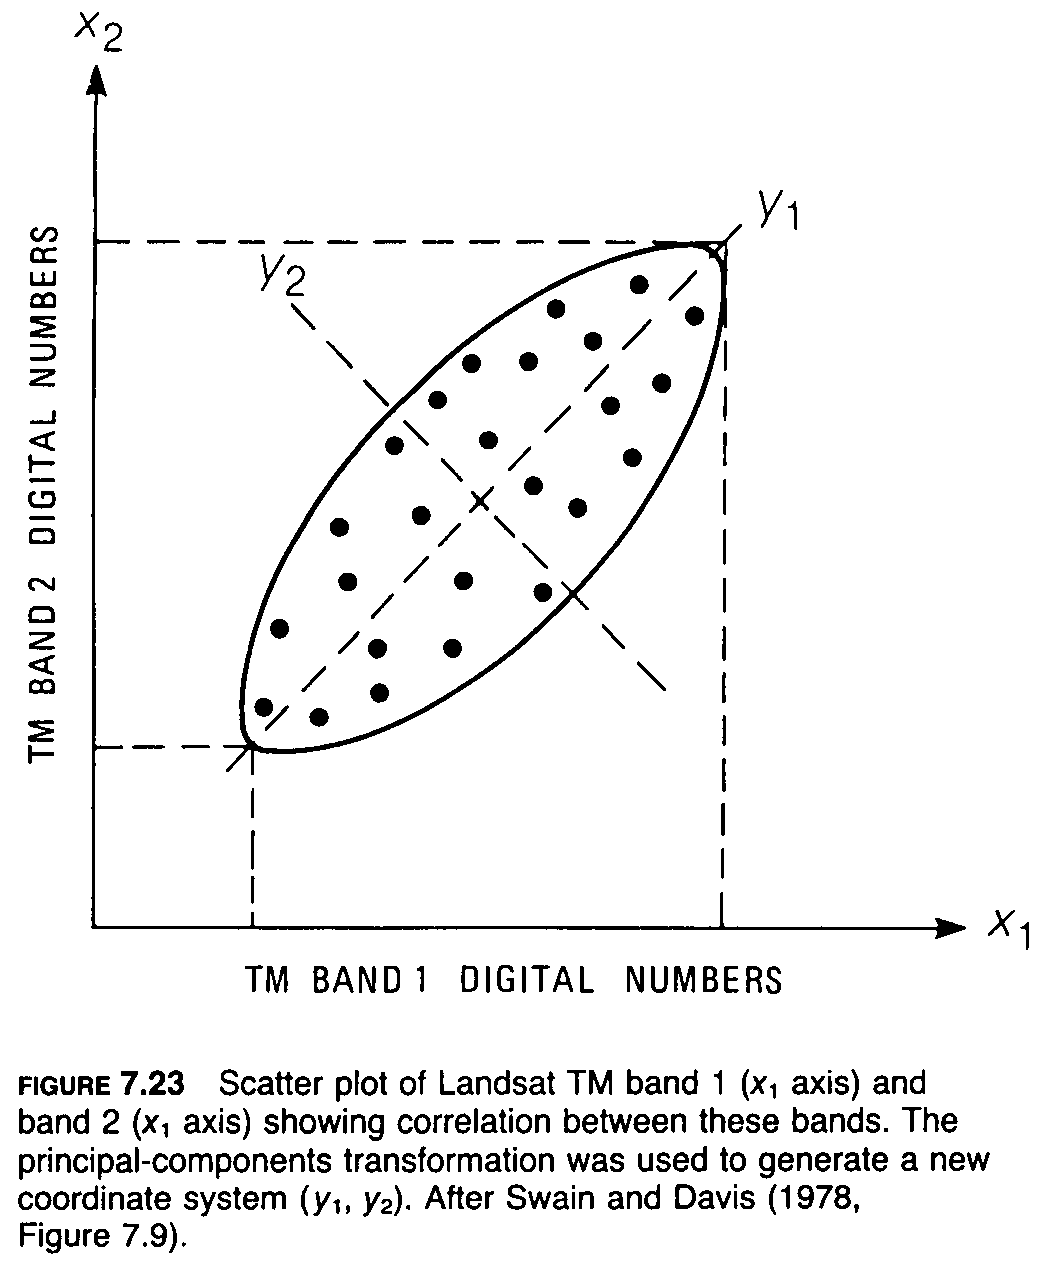
The principal-components transformation, originally known as the Karhunen-Loeve transformation (Loeve, 1955), is used to compress multispectral data sets by calculating a new coordinate system. For the two bands of data in Figure 7.23, the transformation defines a new axis (y1) oriented in the long dimension of the distribution and a second axis (Y2) perpendicular to y1. The mathematical operation makes a linear combination of pixel values in the original coordinate system that results in pixel values in the new coordinate system:
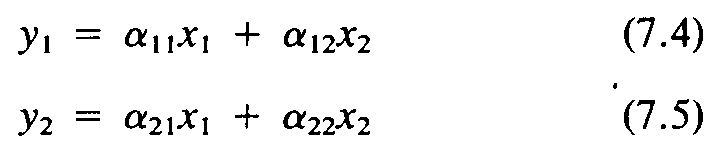
where (x1, x2) are the pixel coordinates in the original system; (y1, y2) are the coordinates in the new system; and a11, a12, and a22 are constants. In Figure 7.23 note that the range of pixel values for y, is greater than the ranges for either of the original coordinates, x1 or x2 and that the range of values for y2 is relatively small.
The same principal-components transformation may be carried out for multispectral data sets consisting of any number of bands. Additional coordinate directions are defined sequentially. Each new coordinate is oriented perpendicular to all the previously defined directions and in the direction of the remaining maximum density of pixel data points. For each pixel, new DNs are determined relative to each of the new coordinate axes. A set of DN values is determined for each pixel relative to the first principal component. These DNs are then used to generate an image of the first principal component. The same procedure is used to produce images for the remaining principal components. The preceding description of the principal-components transformation is summarized from Swain and Davis (1978); additional information is given in Moik (1980).
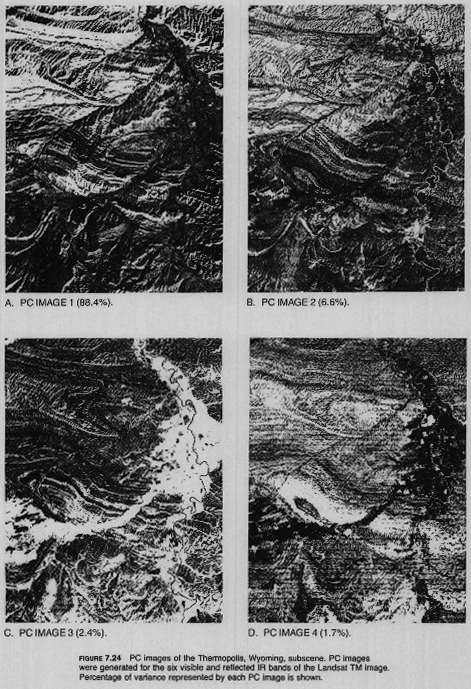
A principal-components transformation was performed on the three visible and three reflected IR bands of TM data for the Thermopolis, Wyoming, subscene (Figure 4.20). Each pixel was assigned six new DNs for the first through the sixth principal-component coordinate axes. Figure 7.24 illustrates the six PC images which have been enhanced with a linear contrast stretch. As noted earlier, each successive principal component accounts for a progressively smaller proportion of the variation of the original multispectral data set. These percentages of variation are indicated for each PC image in Figure 7.24 and are plotted graphically in Figure 7.25. The first three PC images contain 97 percent of the variation of the original six TM bands, which is a significant compression of data. The PC image 1 (Figure 7.24A) is dominated by topography, expressed as highlights and shadows, that is highly correlated in all six of the original TM bands. PC image 2 (Figure 7.24B) is dominated by differences in albedo that also correlate from band to band because pixels that are bright in one TM band tend to be bright in adjacent bands. The least correlated data are noise, such as line striping and dropouts, which occur in different detectors and different bands. In the example of Figure 7.24, noise dominates PC images 4, 5, and 6, which together account for only 2.6 percent of the original variation. It is interesting to note, however, that PC image 6 (Figure 7.24F) displays parallel arcuate dark bands in the outcrop belt of the Chugwater Formation that are clearly related to lithologic variations in this unit.
Any three principal-component images can be combined to create a color image by assigning the data that make up each image to a separate primary color. Plate 10C was produced by combining PC images from Figure 7.24 in the following fashion: PC image 2 = red, PC image 3 = green, PC image 4 = blue. PC image 1 was not used in order to minimize topographic effects. As a result, the color PC image displays a great deal of spectral variation in the vegetation and rocks, although the three images constitute only 10.7 percent of the variation of the original data set.
In summary, the principal-components transformation has several advantages: (1) most of the variance in a multispectral data set is compressed into one or two PC images; (2) noise may be relegated to the less-correlated PC images; and (3) spectral differences between materials may be more apparent in PC images than in individual bands.
For example, the spectral reflectance curve (Figure 4.14) shows that the maximum reflectance of vegetation occurs in TM band 4 (reflected IR) and that reflectance is considerably lower in band 2 (green). Figure 7.26C shows the ratio image 4/2, the image that results when the DNs in band 4 are divided by the DNs in band 2. The brightest signatures in this image correlate with the cultivated fields along the Wind River and Owl Creek. For location of features in this and other discussions of the Thermopolis subscene, see the description and map of the area in Chapter 4. Red materials, such as the Chugwater Formation with its high content of iron oxide, have their maximum reflectance in band 3. Thus, in the ratio image 3/1 (red/blue) of Figure 7.26A, the Chugwater outcrops have very bright signatures.
Like PC images, any three ratio images may be combined to produce a color image by assigning each image to a separate primary color. In Plate 10D the ratio images 3/1, 5/7, and 3/5 are combined as red, green, and blue respectively. This image should be compared with the normal color and IR color images of Plate 5C,D and with the geologic map of Figure 4.21. The color variations of the ratio color image express more geologic information and have greater contrast between units than do the conventional color images. Ratio images emphasize differences in slopes of spectral reflectance curves between the two bands of the ratio. In the visible and reflected IR regions, the major spectral differences of materials are expressed in the slopes of the curves, therefore individual ratio images and ratio color images enable one to extract reflectance variations. A disadvantage of ratio images is that they suppress differences in albedo; materials that have different albedos but similar slopes of their spectral curves may be indistinguishable in ratio images.
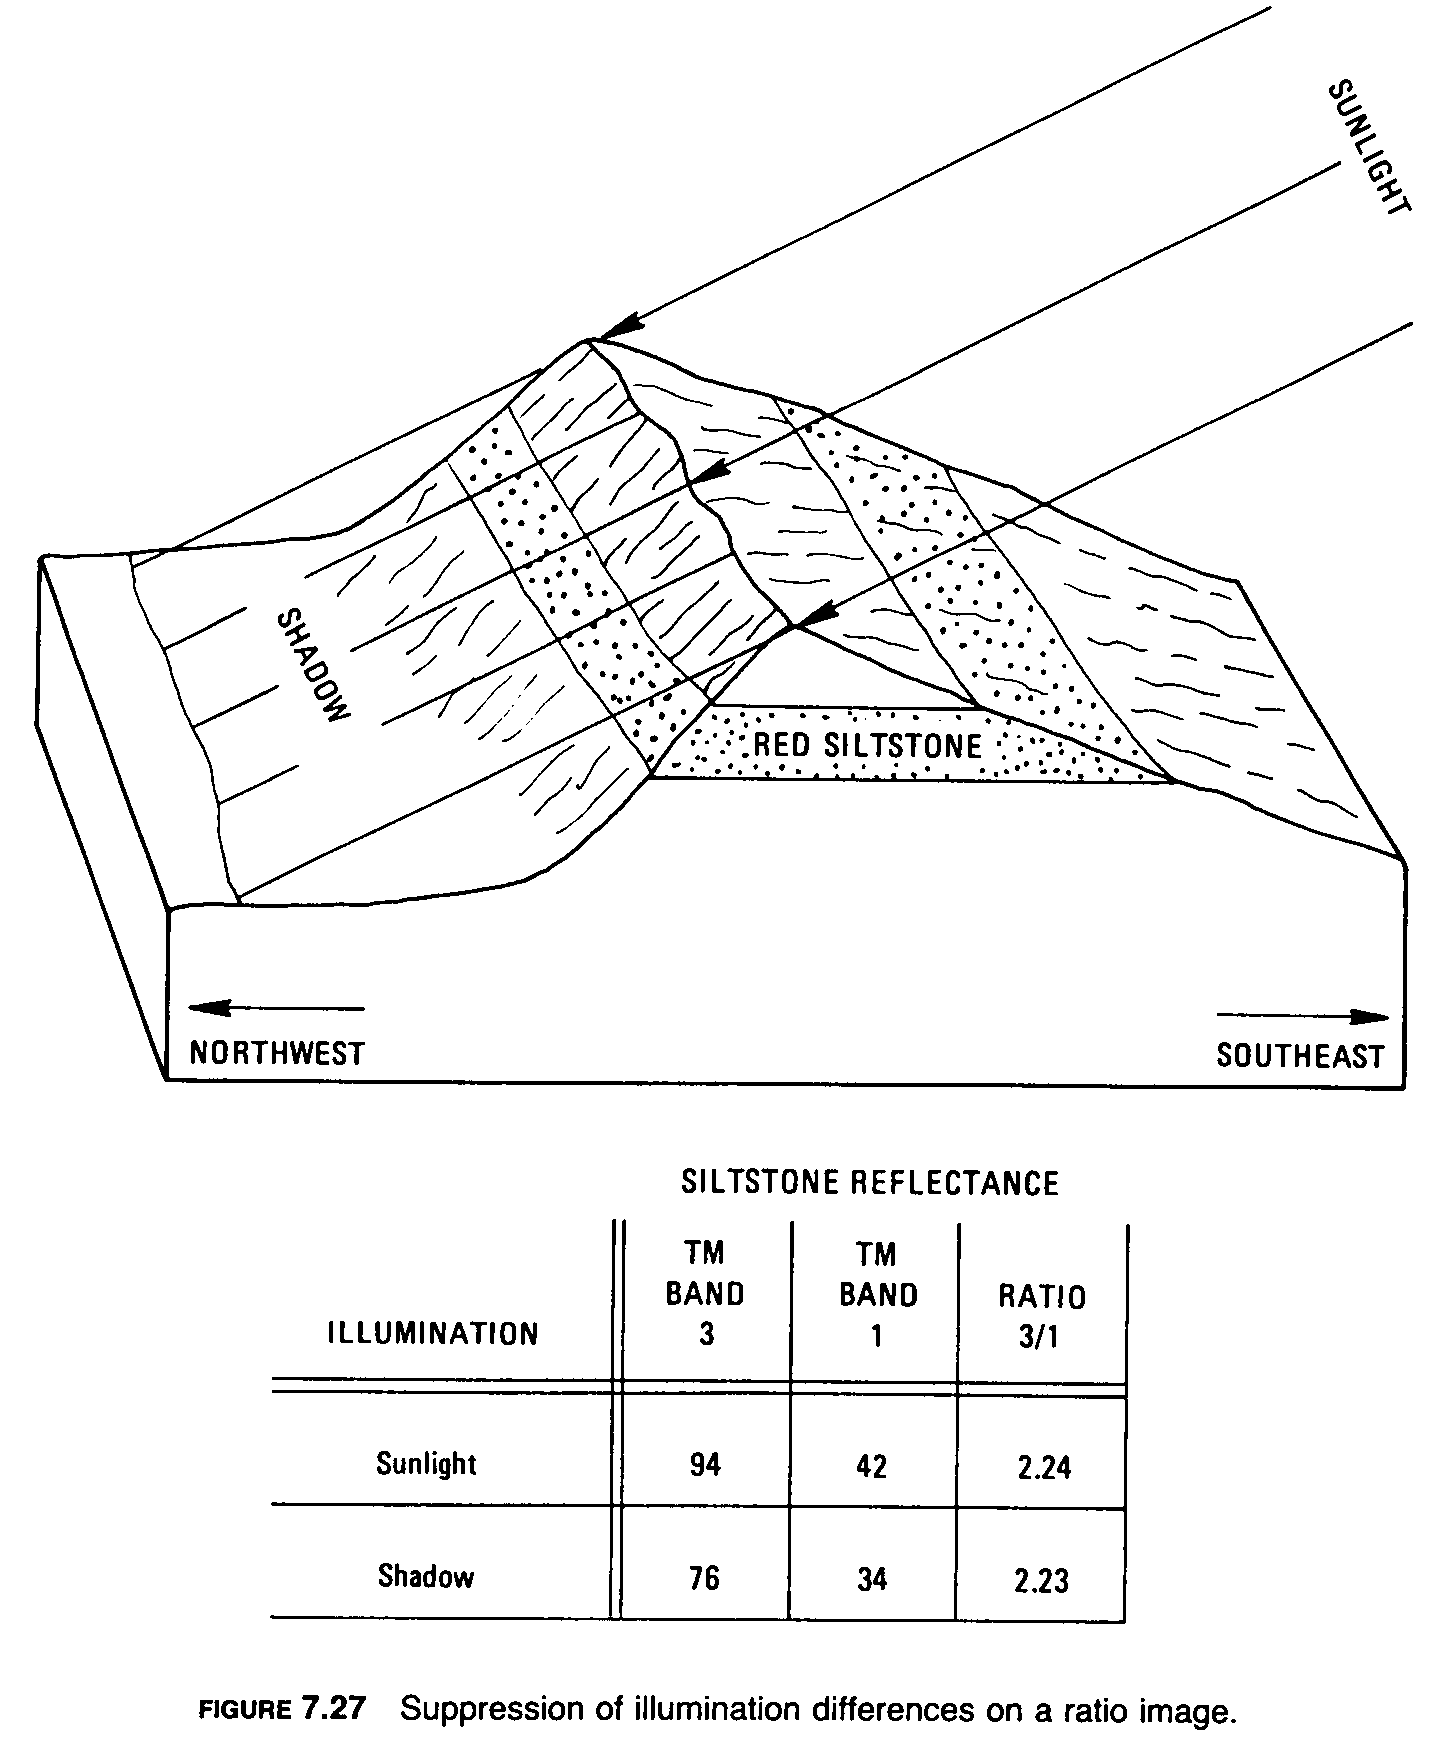
Ratio images also minimize differences in illumination conditions, thus suppressing the expression of topography. In Figure 7.27 a red siltstone bed crops out on both the sunlit and shadowed sides of a ridge. In the individual Landsat TM bands 1 and 3 the DNs of the siltstone are lower in the shadowed area than in the sunlit outcrop, which makes it difficult to follow the siltstone bed around the hill. Values of the ratio image 3/1, however, are identical in the shadowed and sunlit areas, as shown by the chart in Figure 7.27; thus the siltstone has similar signatures throughout the ratio image. This suppression of topography can be seen by comparing the ratio images of the Thermopolis subscene (Figure 7.26) with images of the individual TM bands (Figure 4.20).
In addition to ratios of individual bands, a number of other ratios may be computed. An individual band may be divided by the average for all the bands, resulting in normalized ratios. Another combination is to divide the difference between two bands by their sum: for example, (band 4 - band 5)/(band 4 + band 5). Ratios of this type are used to process data from environmental satellites, as described in Chapter 9.
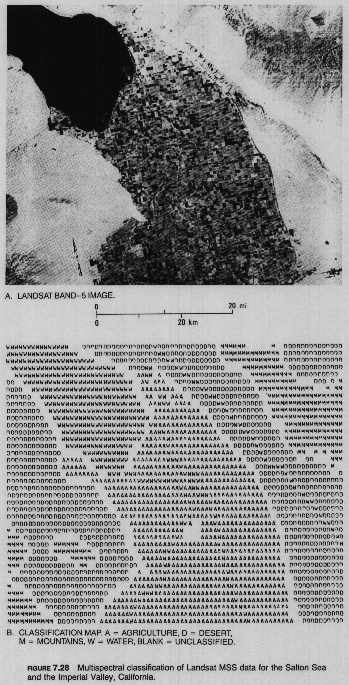
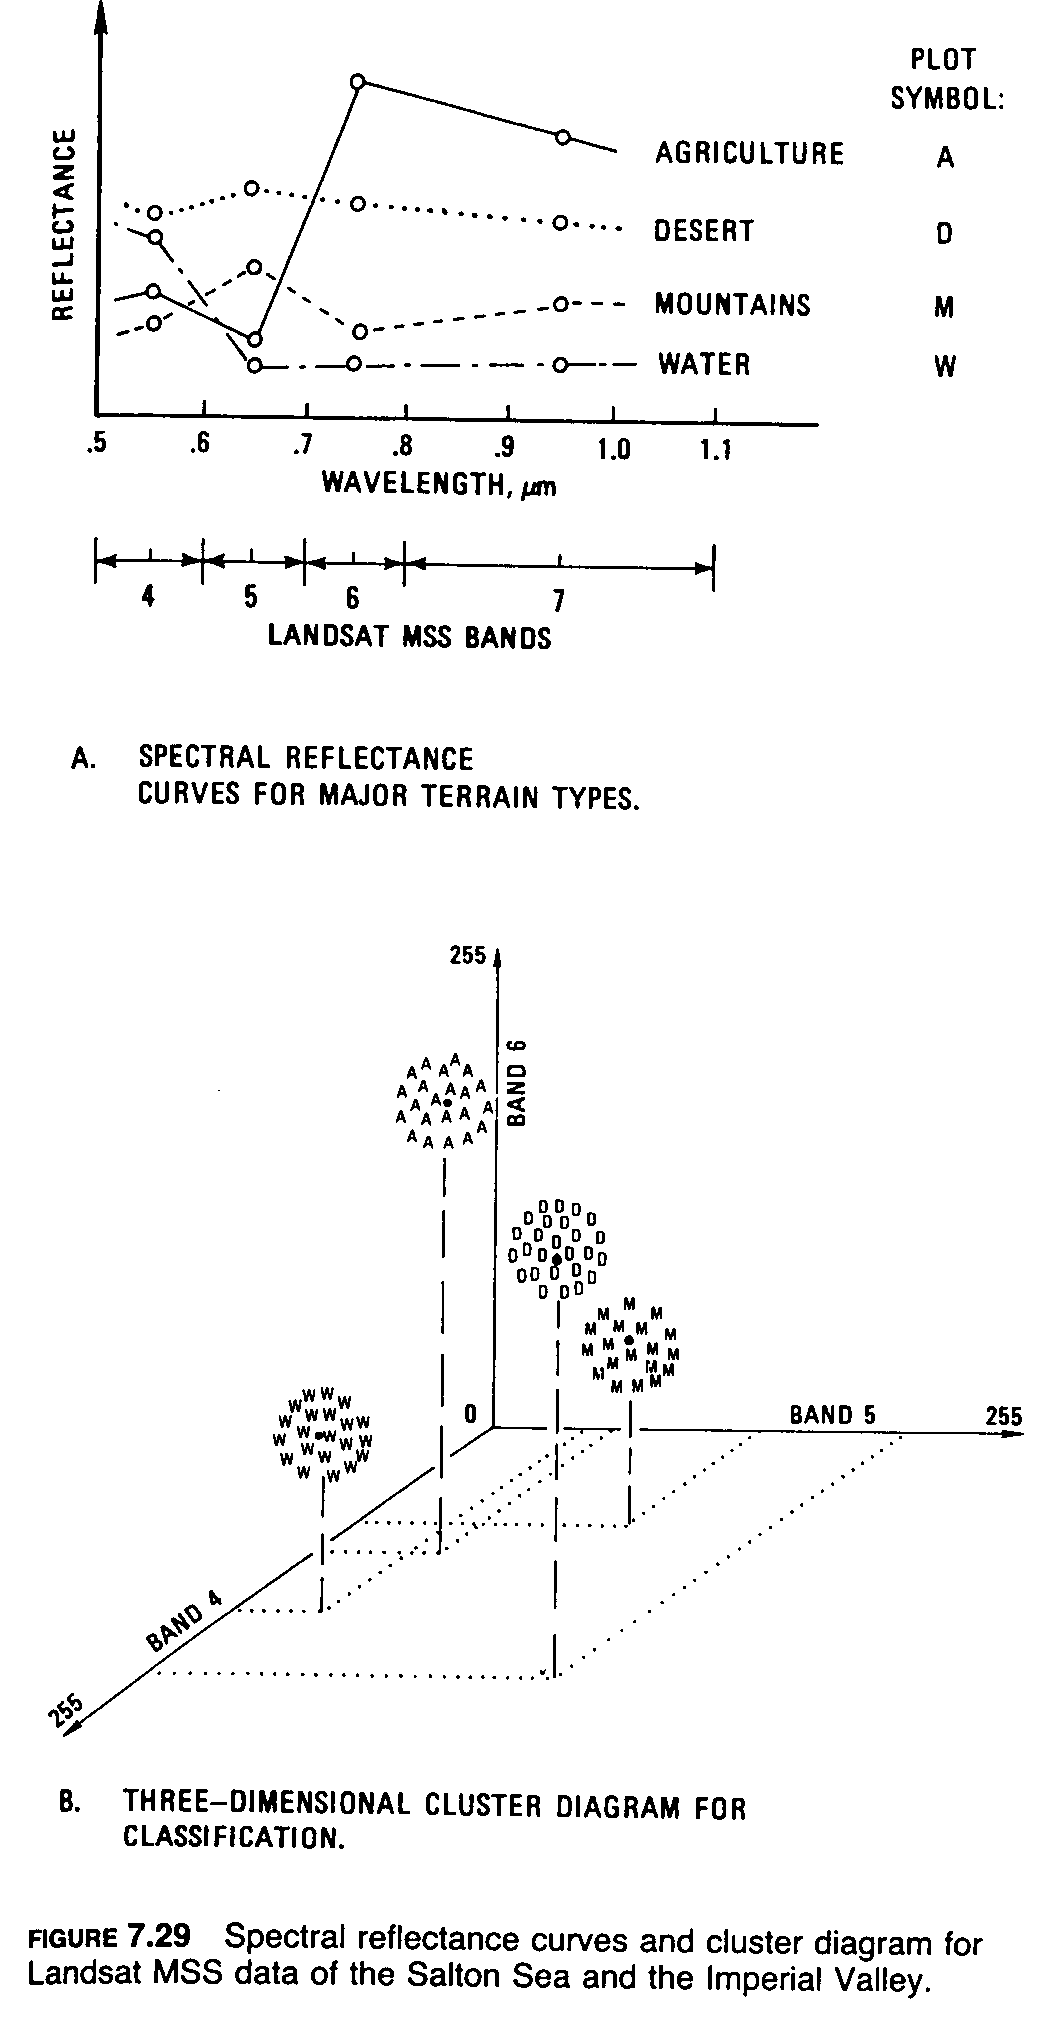
Procedure Multispectral classification is illustrated diagrammatically with a Landsat MSS image of southern California that covers the Salton Sea, Imperial Valley, and adjacent mountains and deserts (Figure 7.28A). Reflectance data from the four MSS bands are shown in Figure 7.29A for representative pixels of water, agriculture, desert, and mountains. The data points are plotted at the center of the spectral range of each MSS band. In Figure 7.29B the reflectance ranges of bands 4, 5, and 6 form the axes of a three-dimensional coordinate system. The solid dots are the loci of the four pixels in Figure 7.29A. Plotting additional pixels of the different terrain types produces three-dimensional clusters or ellipsoids. The surface of the ellipsoid forms a decision boundary, which encloses all pixels for that terrain category. The volume inside the decision boundary is called the decision space. Classification programs differ in their criteria for defining the decision boundaries. In many programs the analyst is able to modify the boundaries to achieve optimum results. For the sake of simplicity the cluster diagram (Figure 7.29B) is shown with only three axes. In actual practice the computer employs a separate axis for each spectral band of data: four for MSS and six or seven for TM.
Once the boundaries for each cluster, or spectral class, are defined, the computer retrieves the spectral values for each pixel and determines its position in the classification space. Should the pixel fall within one of the clusters, it is classified accordingly. Pixels that do not fall within a cluster are considered unclassified. In practice the computer calculates the mathematical probability that a pixel belongs to a class; if the probability exceeds a designated threshold (represented spatially by the decision boundary), the pixel is assigned to that class. Applying this method to the original data of the Salton Sea and the Imperial Valley scene produces the classification map of Figure 7.28B. Note that the blank areas (unclassified category) occur at the boundaries between classes where the pixels include more than one terrain type.
There are two major approaches to multispectral classification:
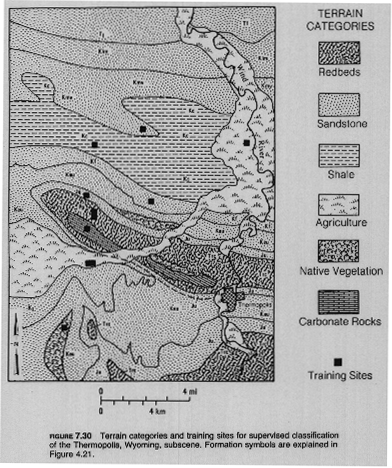
Supervised Classification The first step in the supervised classification is to select training sites for each of the terrain categories. In Figure 7.30 the training sites are indicated by black rectangles. Some categories are represented by more than one training site in order to cover the full range of reflectance characteristics. Figure 7.31 shows TM reflectance spectra for the terrain categories. Note the wider range of spectral variation in the reflected IR bands (4, 5, and 7) than in the visible bands (1, 2, and 3). In the first attempt at supervised classification, training sites were selected for each of the geologic formations, but the results showed that individual formations of the same rock type had similar or overlapping spectral characteristics and were assigned to the same class. For example, many of the formations are sandstones, which proved to be spectrally similar despite their different geologic ages. The final classification identified rocks as sandstone, shale, and redbeds. The resulting supervised-classification map is shown in Plate 11A, in which the colors represent the six major terrain classes and black indicates unclassified pixels. The legend identifies the terrain class represented by each color and the percentage of the map occupied by each class as calculated by the classification program. The color classification map may be evaluated by comparing it with Figure 7.30, which is based on geologic maps of the Thermopolis area. Plate 11A shows the major terrain categories accurately. Some narrow belts of the shale class are shown interbedded with the sandstone class; this is correct because several sandstone formations, such as the Frontier Formation, include shale beds. The proportion of shale in the classification map is probably understated for the following reason. Shale weathers to very fine particles that are easily removed by wind and water. Sandstone, however, weathers to relatively coarse fragments of sand and gravel that may be transported downslope to partially conceal underlying shale beds. This relationship is shown where the course of dry streams that cross the outcrop of Cody Shale are classified as sandstone because of the transported sand and sandstone gravel in the stream beds.
Unsupervised Classification The unsupervised classification results are shown in the map and legend of Plate 11B . This particular program automatically defined 16 classes for the scene. After the 16 unsupervised classes were calculated, each class was displayed for inspection by the analyst, who then combined various categories into the 8 classes shown in Plate 11B. Distribution patterns of the sandstone and shale classes are similar to the patterns in the supervised map. The computer recognized two spectral subdivisions of the Chugwater Formation: a lower member shown in red and an upper member shown in orange (Plate 11B). The lower member is confined to the Chugwater outcrop belt, but the upper member is recognized beyond the Chugwater outcrops, where it apparently represents patches of reddish soil. The unsupervised classification recognized native vegetation and 3 distinct classes of agriculture.
Neither classification map recognized outcrops of carbonate rocks of the Phosphoria Formation, shown in the map of Figure 7.30. Aside from the cover of native vegetation, the weathered carbonate outcrops are classified as sandstone in both maps. Apparently the reflectance spectrum of the carbonate rocks in the TM bands is not distinguishable from that of sandstone. Planned field measurements using a portable reflectance spectrometer will evaluate these properties.
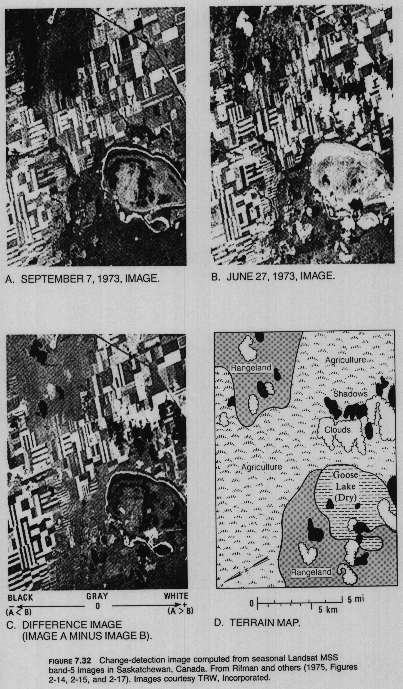
The change-detection process is illustrated with Landsat MSS band-5 images of the Goose Lake area of Saskatchewan, Canada (Figure 7.32). The DN of each pixel in image B is subtracted from the DN of the corresponding registered pixel in image A. The resulting values are linearly stretched and displayed as the change-detection image (Figure 7.32C). The location map (Figure 7.32D) aids in understanding signatures in the difference image. Neutral gray tones representing areas of little change are concentrated in the northwest and southeast and correspond to forested terrain. Forest terrain has a similar dark signature on both original images. Some patches within the ephemeral Goose dry lake have similar light signatures on images A and B, resulting in a neutral gray tone on the different image. The clouds and shadows present only on image B produce dark and light tones respectively on the difference image. The agricultural practice of seasonally alternating between cultivated and fallow fields is clearly shown by the light and dark tones on the difference image. On the original images, the fields with light tones have crops or stubble and the fields with dark tones are bare earth.
Change-detection processing is also useful for producing difference images for other remote sensing data, such as between nighttime and daytime thermal IR images, as illustrated in Chapter 5.
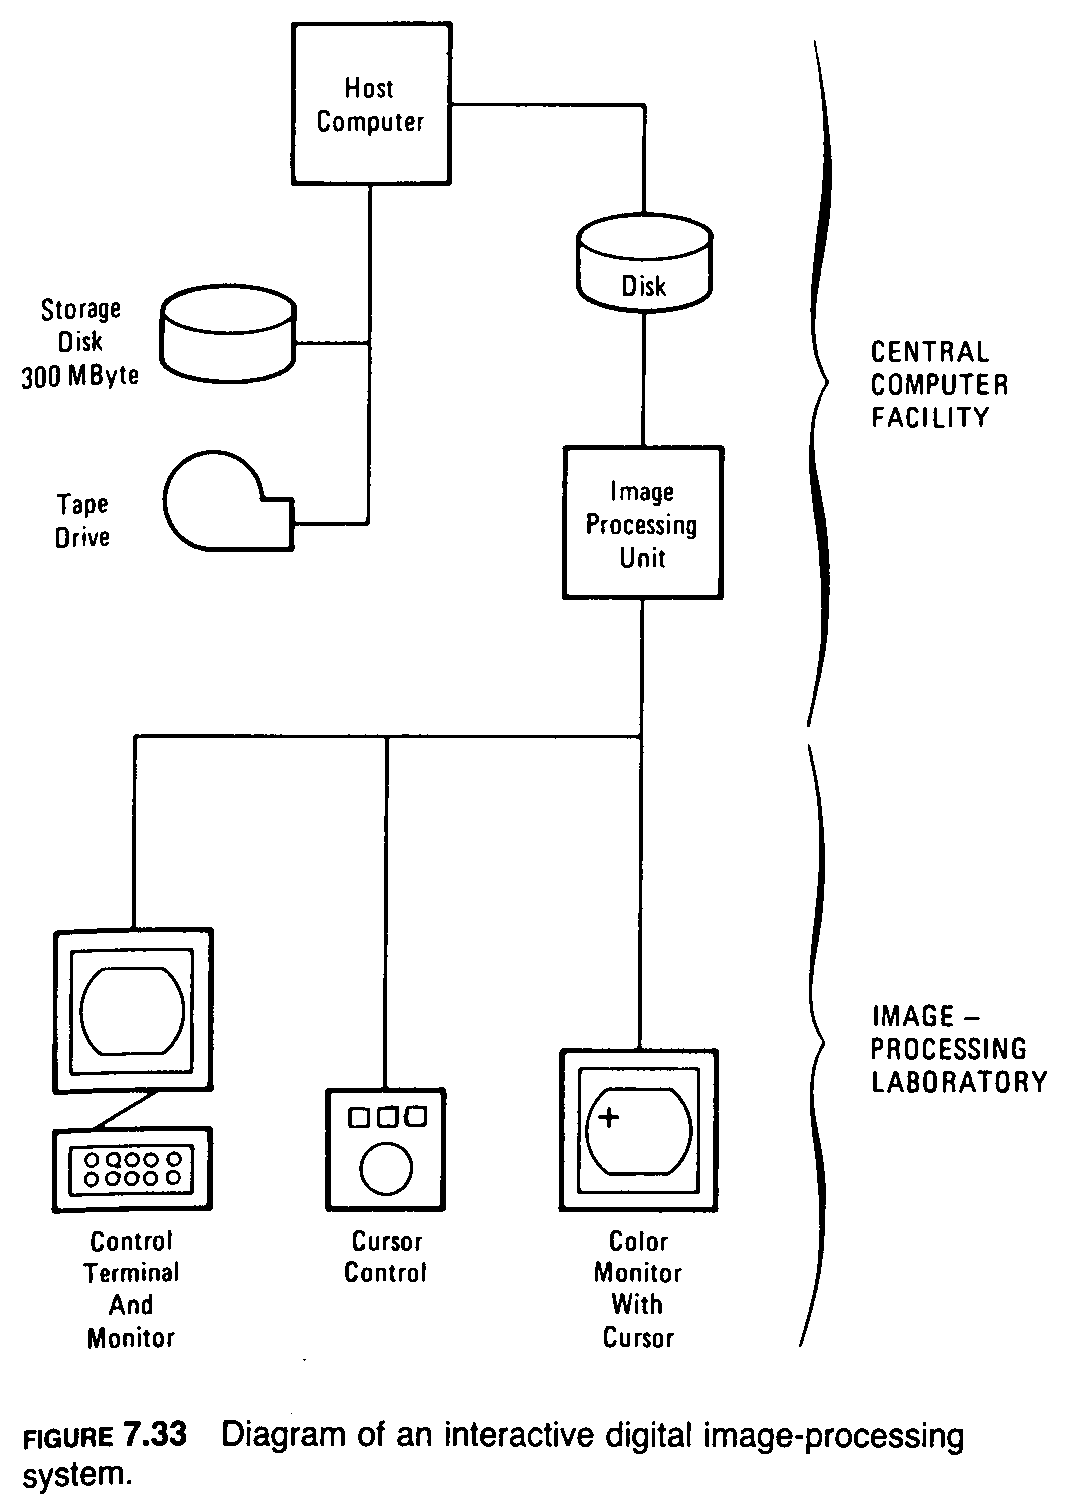
The analyst selects a subscene by using the cursor, which is a bright cross that is moved across the screen with the aid of the cursor control. The cursor control is a track ball that the analyst manipulates to shift the cursor on the screen. For each position of the cursor, its location in the image is displayed on the screen by numbers showing the corresponding scan line and pixel. The analyst positions the cursor at the northwest corner of the desired 512-by-512 subscene and types a command that identifies this locality. The analyst then positions the cursor at the southeast corner of the subscene and enters the command. The system then selects this subscene from the storage disk, transfers it to the local disk in the image processing unit, and displays the 512-by-512 array of pixels on the color monitor. With this display the analyst is ready to begin a session of interactive image processing. The analyst specifies the desired digital processing, views the results on the monitor in near real time, and makes further adjustments. The analyst continues to interact with the data via the cursor and keyboard until obtaining the desired results.
A typical interactive processing session can involve combinations of restoration, enhancement, and information extraction. The first step is to examine the 512-by-512 display for defects such as line dropouts and noise that are corrected. Next the image is enhanced using a contrast stretch routine. The analyst examines each of the three spectral bands separately, together with its histogram, and produces an optimum enhanced image for each band. The bands are then viewed together in color, and any contrast adjustments are made. At this point, the image may be transformed into intensity, hue, and saturation components. The saturation is stretched, and the IHS image is then transformed back into RGB components and viewed on the monitor. When the results are satisfactory for the 512-by-512 subscene, the various restoration and enhancement programs and parameters are then applied to the entire Landsat scene in the batch-processing mode. In batch processing the analyst does not interact with the data during the session and sees no results until processing is completed. For this reason, batch jobs may be run during the night shift of the computer facility when they will not compete for computer resources with interactive users on the day shift. In some systems, a separate large mainframe computer, such as a Cray supercomputer, is employed for batch processing. At the conclusion of a batch-processing session, the computer creates a file of processed pixels. The tape drive (Figure 7.33) copies the processed pixels onto a plot tape, which is used with an image-plotting system (Figure 7.2) to produce the photographic images.
Once an enhanced image is generated, the analyst may proceed to extract information by creating ratio images using the original data for the 512-by-512 subscene, not the enhanced data. Different ratio images are interactively combined in different colors to produce the optimum combination for recognizing desired features. At this point, a color ratio composite image for the entire scene may be produced in the batch mode. The same processing strategy is used to perform supervised multispectral classifications.
The less expensive systems are hosted on personal computers or minicomputers. Because of their small memories, most of these systems can process only small subscenes of Landsat images but are useful for teaching purposes. The more expensive systems are hosted on larger computers and can process entire Landsat scenes in the batch-processing mode. These systems can be connected to even more powerful computers for faster processing.
Some potential users have monitors, terminals, and processors but lack the software for image processing. Software for various purposes, including image processing, that was developed under contract to the U.S. government is available to the public at modest prices. This software is available through the Computer Software Management and Information Center (COSMIC) at the University of Georgia, Athens, GA 30602. COSMIC will provide a copy of their catalog, which has a section describing available software for image processing.
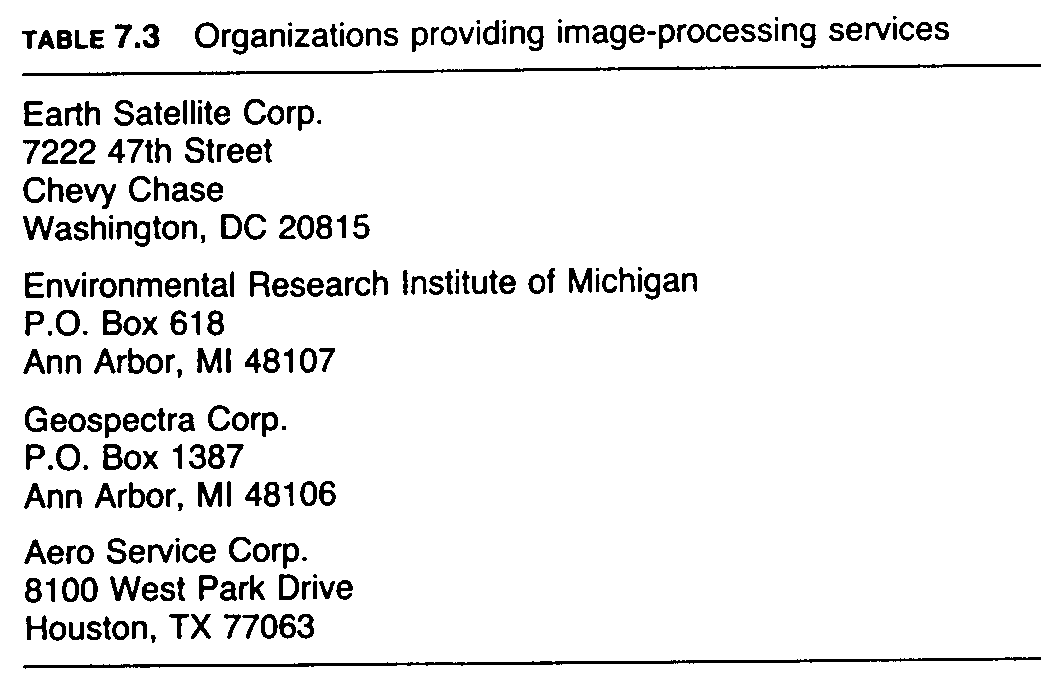
Some users may require processed images but do not wish to invest in a processing system. There are a number of facilities that for a fee can process images to the user's specifications (Table 7.3).
A common query is whether the benefits of image processing are commensurate with the cost. This is a difficult question that can only be answered by the context of the user's needs. If digital filtering, for example, reveals a previously unrecognized fracture pattern that in turn leads to the discovery of major ore deposits, the cost benefits are obvious. On the other hand, it is difficult to state the cost benefits of improving the accuracy of geologic and other maps through digital processing of remote sensing data. However, it should also be noted that technical advances in software and hardware are steadily increasing the volume and complexity of the processing that can be performed, often at a reduced unit cost.
Bernstein, R., and D. G. Ferneyhough, 1975, Digital image processing: Photogrammetric Engineering, v. 41, p. 1465-1476.
Bernstein, R., J. B. Lottspiech, H. J. Myers, H. G. Kolsky, and R. D. Lees, 1984, Analysis and processing of Landsat 4 sensor data using advanced image processing techniques and technologies: IEEE Transactions on Geoscience and Remote Sensing, v. GE-22, p. 192-221.
Bryant. M., 1974, Digital image processing: Optronics International Publication 146, Chelmsford, Mass.
Buchanan, M. D., 1979, Effective utilization of color in multidimensional data presentation: Proceedings of the Society of Photo-Optical Engineers, v. 199, p. 9-19.
Chavez, P. S., 1975, Atmospheric, solar, and MTF corrections for ERTS digital imagery: American Society of Photogrammetry, Proceedings of Annual Meeting in Phoenix, Ariz.
Goetz, A. F. H., and others, 1975, Application of ERTS images and image processing to regional geologic problems and geologic mapping in northern Arizona: Jet Propulsion Laboratory Technical Report 32-1597, Pasadena, Calif.
Haralick, R. M., 1984, Digital step edges from zero crossing of second directional filters: IEEE Transactions on Pattern Analysis and Machine Intelligence, v. PAMI-6, p. 58-68.
Holkenbrink, 1978, Manual on characteristics of Landsat computer-compatible tapes produced by the EROS Data Center digital image processing system: U.S. Geological Survey, EROS Data Center, Sioux Falls, S.D.
Loeve, M., 1955, Probability theory: D. van Nostrand Company, Princeton, N.J.
Moik, H., 1980, Digital processing of remotely sensed images: NASA SP no. 431, Washington, D.C.
NASA, 1983, Thematic mapper computer compatible tape: NASA Goddard Space Flight Center Document LSD-ICD-105, Greenbelt, Md.
Rifman, S. S., 1973, Digital rectification of ERTS multispectral imagery: Symposium on Significant Results Obtained from ERTS-1, NASA SP-327, p. 1131-1142.
Rifman, S. S., and others, 1975, Experimental study of application of digital image processing techniques to Landsat data: TRW Systems Group Report 26232-6004-TU-00 for NASA Goddard Space Flight Center Contract NAS 5-20085, Greenbelt, Md.
Short, N. M., and L. M. Stuart, 1982, The Heat Capacity Mapping Mission (HCMM) anthology: NASA SP 465, U.S. Government Printing Office, Washington, D.C.
Simpson, C. J., J. F. Huntington, J. Teishman, and A. A. Green, 1980, A study of the Pine Creek geosyncline using integrated Landsat and aeromagnetic data in Ferguson, J., and A. B. Goleby, eds., International Uranium Symposium on the Pine Creek Geosyncline: International Atomic Energy Commission Proceedings, Vienna, Austria.
Soha, J. M., A. R. Gillespie, M. J. Abrams, and D. P. Madura, 1976, Computer techniques for geological applications: Caltech/JPL Conference on Image Processing Technology, Data Sources and Software for Commercial and Scientific Applications, Jet Propulsion Laboratory SP 43-30, p. 4.1-4.21, Pasadena, Calif.
Swain, P. H., and S. M. Davis, 1978, Remote sensing--the quantitative approach: McGraw-Hill Book Co., N.Y.
Castleman, K. R., 1977, Digital image processing: Prentice-Hall, Englewood Cliffs, N.J.
Gonzalez, R. C., and P. Wintz, 1977, Digital image processing: Addison-Wesley Publishing Co., Reading, Mass.
Pratt, W. K., 1977, Digital image processing: John Wiley & Sons, N.Y.
Rosenfeld, A., and A. C. Kak, 1982, Digital picture processing, second edition: Academic Press, Orlando, Fla.