 Reproduced, with permission, from:
Hofmann, D. J., S. J. Oltmans, J. M. Harriss, S. Solomon, T. Deshler, and B. J. Johnson. 1992. Observation and possible causes of new ozone depletion in Antarctica in 1991. Nature 359: 283-87.
Reproduced, with permission, from:
Hofmann, D. J., S. J. Oltmans, J. M. Harriss, S. Solomon, T. Deshler, and B. J. Johnson. 1992. Observation and possible causes of new ozone depletion in Antarctica in 1991. Nature 359: 283-87.
* NOAA Climate Monitoring and Diagnostics Laboratory, Boulder, Colorado 80303, USA
+ NOAA Aeronomy Laboratory, Boulder, Colorado 80303, USA
++ Department of Atmospheric Science, University of Wyoming, Laramie, Wyoming 80271, USA
Local ozone reductions approaching 50% in magnitude were observed during the Antarctic spring in the 11-13 and 25-30 km altitude regions over South Pole and McMurdo Stations in 1991. These reductions, at altitudes where depletion has not been observed previously, resulted in a late September total ozone column 10-15% lower than previous years. The added depletion in the lower stratosphere was observed to coincide with penetration into the polar vortex of highly enhanced concentrations of aerosol particles from volcanic activity in 1991.
ON the basis of the phase of the quasi-biennial oscillation (QBO) of equatorial stratospheric winds[1], and tropical Pacific sea surface temperatures (SST)[2,3] which affect the timing of transport of ozone to the Antarctic continent in spring, 1991 was expected to be a year of early recovery of the springtime Antarctic ozone hole and only moderate ozone depletion. Although the recovery of the ozone hole indeed occurred early in 1991 (mid- November), total ozone nevertheless reached record lows in September even though values during the October minimum period at South Pole were no lower than the previous record low values observed in 1987. Antarctic ozone depletion generally extends over the altitude range from 12 to 22 km (ref. 4), the dominant region of polar stratospheric cloud (PSC) formation. From balloon-borne observations, which give the vertical ozone profile, we have determined that this 'normal' ozone hole was only slightly more severe during September in 1991 than in 1987, 1989 or 1990; additional ozone depletion was observed, however, in both the 11-13 km and the 25-30 km regions which were the predominant causes of the low total ozone at this time. Homogeneous chlorine chemistry, combined with continually increasing chlorine levels, can explain only a small portion of the high-altitude ozone depletion. The transport of coastal air depleted of ozone by PSCs and/or the aerosol cloud from the volcanic eruption of Mount Pinatubo at 10deg. N in June 1991 might also be involved. The low-altitude ozone reduction occurs simultaneously with high aerosol concentrations, from the August 1991 eruption of Mount Hudson at 46deg. S, arriving in the Antarctic lower stratosphere in September, and is believed to be the result of heterogeneous processes occurring on the surface of the volcanic aerosol.
Observations
Ozone vertical profiles were obtained at South Pole and McMurdo (78deg. S) stations with a digital electrochemical ozonesonde technique which has been used in Antarctica since 1986 (ref. 4). Total ozone is obtained by integration of the vertical profiles of ozone partial pressure for soundings that reach at least 28 km. Beginning on 10 October, there was adequate sunlight to obtain total ozone values with the Dobson spectrophotometer at South Pole station (W. Komhyr, personal communication) and the sonde values agreed with the Dobson values within ~2%.
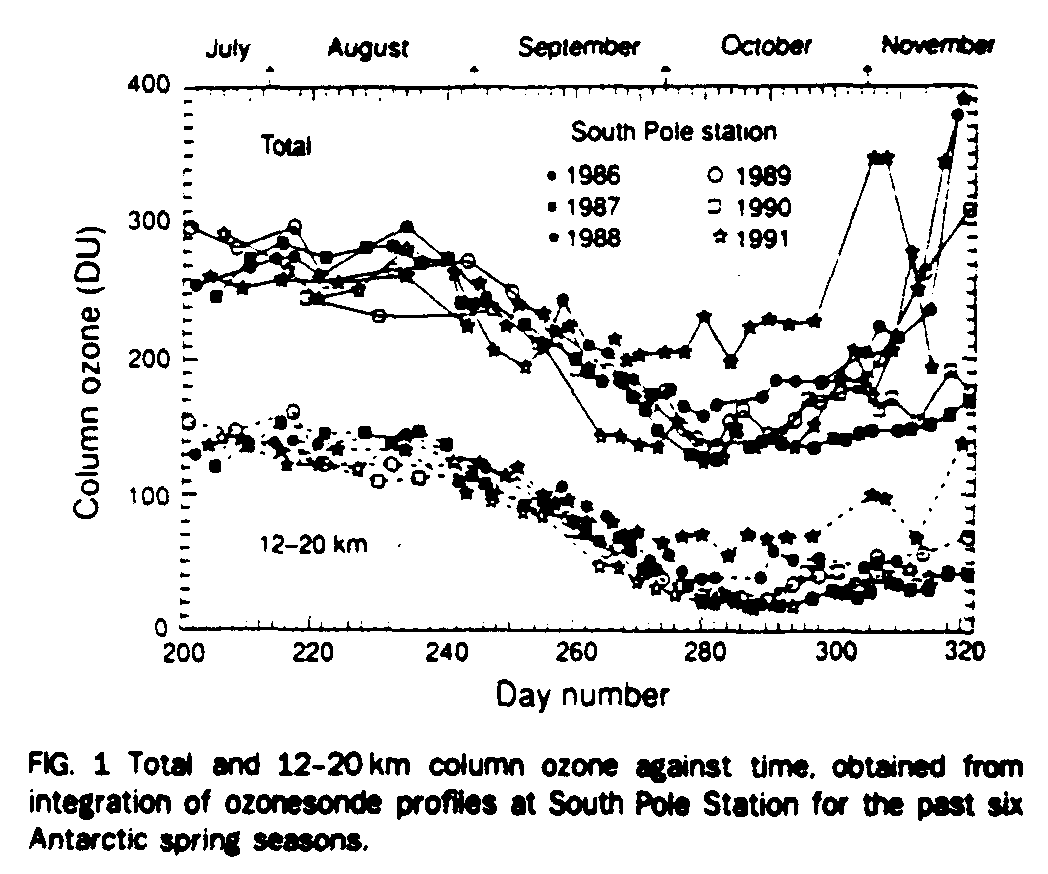
As indicated in Fig. 1, a minimum in total ozone of about 125 Dobson units (DU) was observed at South Pole station on 7 October (Julian day 280). Although this value is not significantly lower than the lowest value observed there in 1987, the September reduction began earlier in 1991 than in any previous year. In late August 1991, total ozone was similar to previous years with a value of ~270 DU on day 240 (28 August); but beginning on day 247 (4 September), six of the next seven measurements were ~30-40 DU (15-20%) lower than observed in the previous five years. The 'normal' ozone hole, represented by the 12-20 km column data in Fig. 1, contributed only about 1/4 of the difference in total ozone between 1991 and previous years during the September decreasing phase. Thus, in terms of total column ozone, 3/4 of the unusual low ozone (~20-30 DU or ~10% of the late August column) during September had to result from new ozone losses in regions not previously subject to depletion.
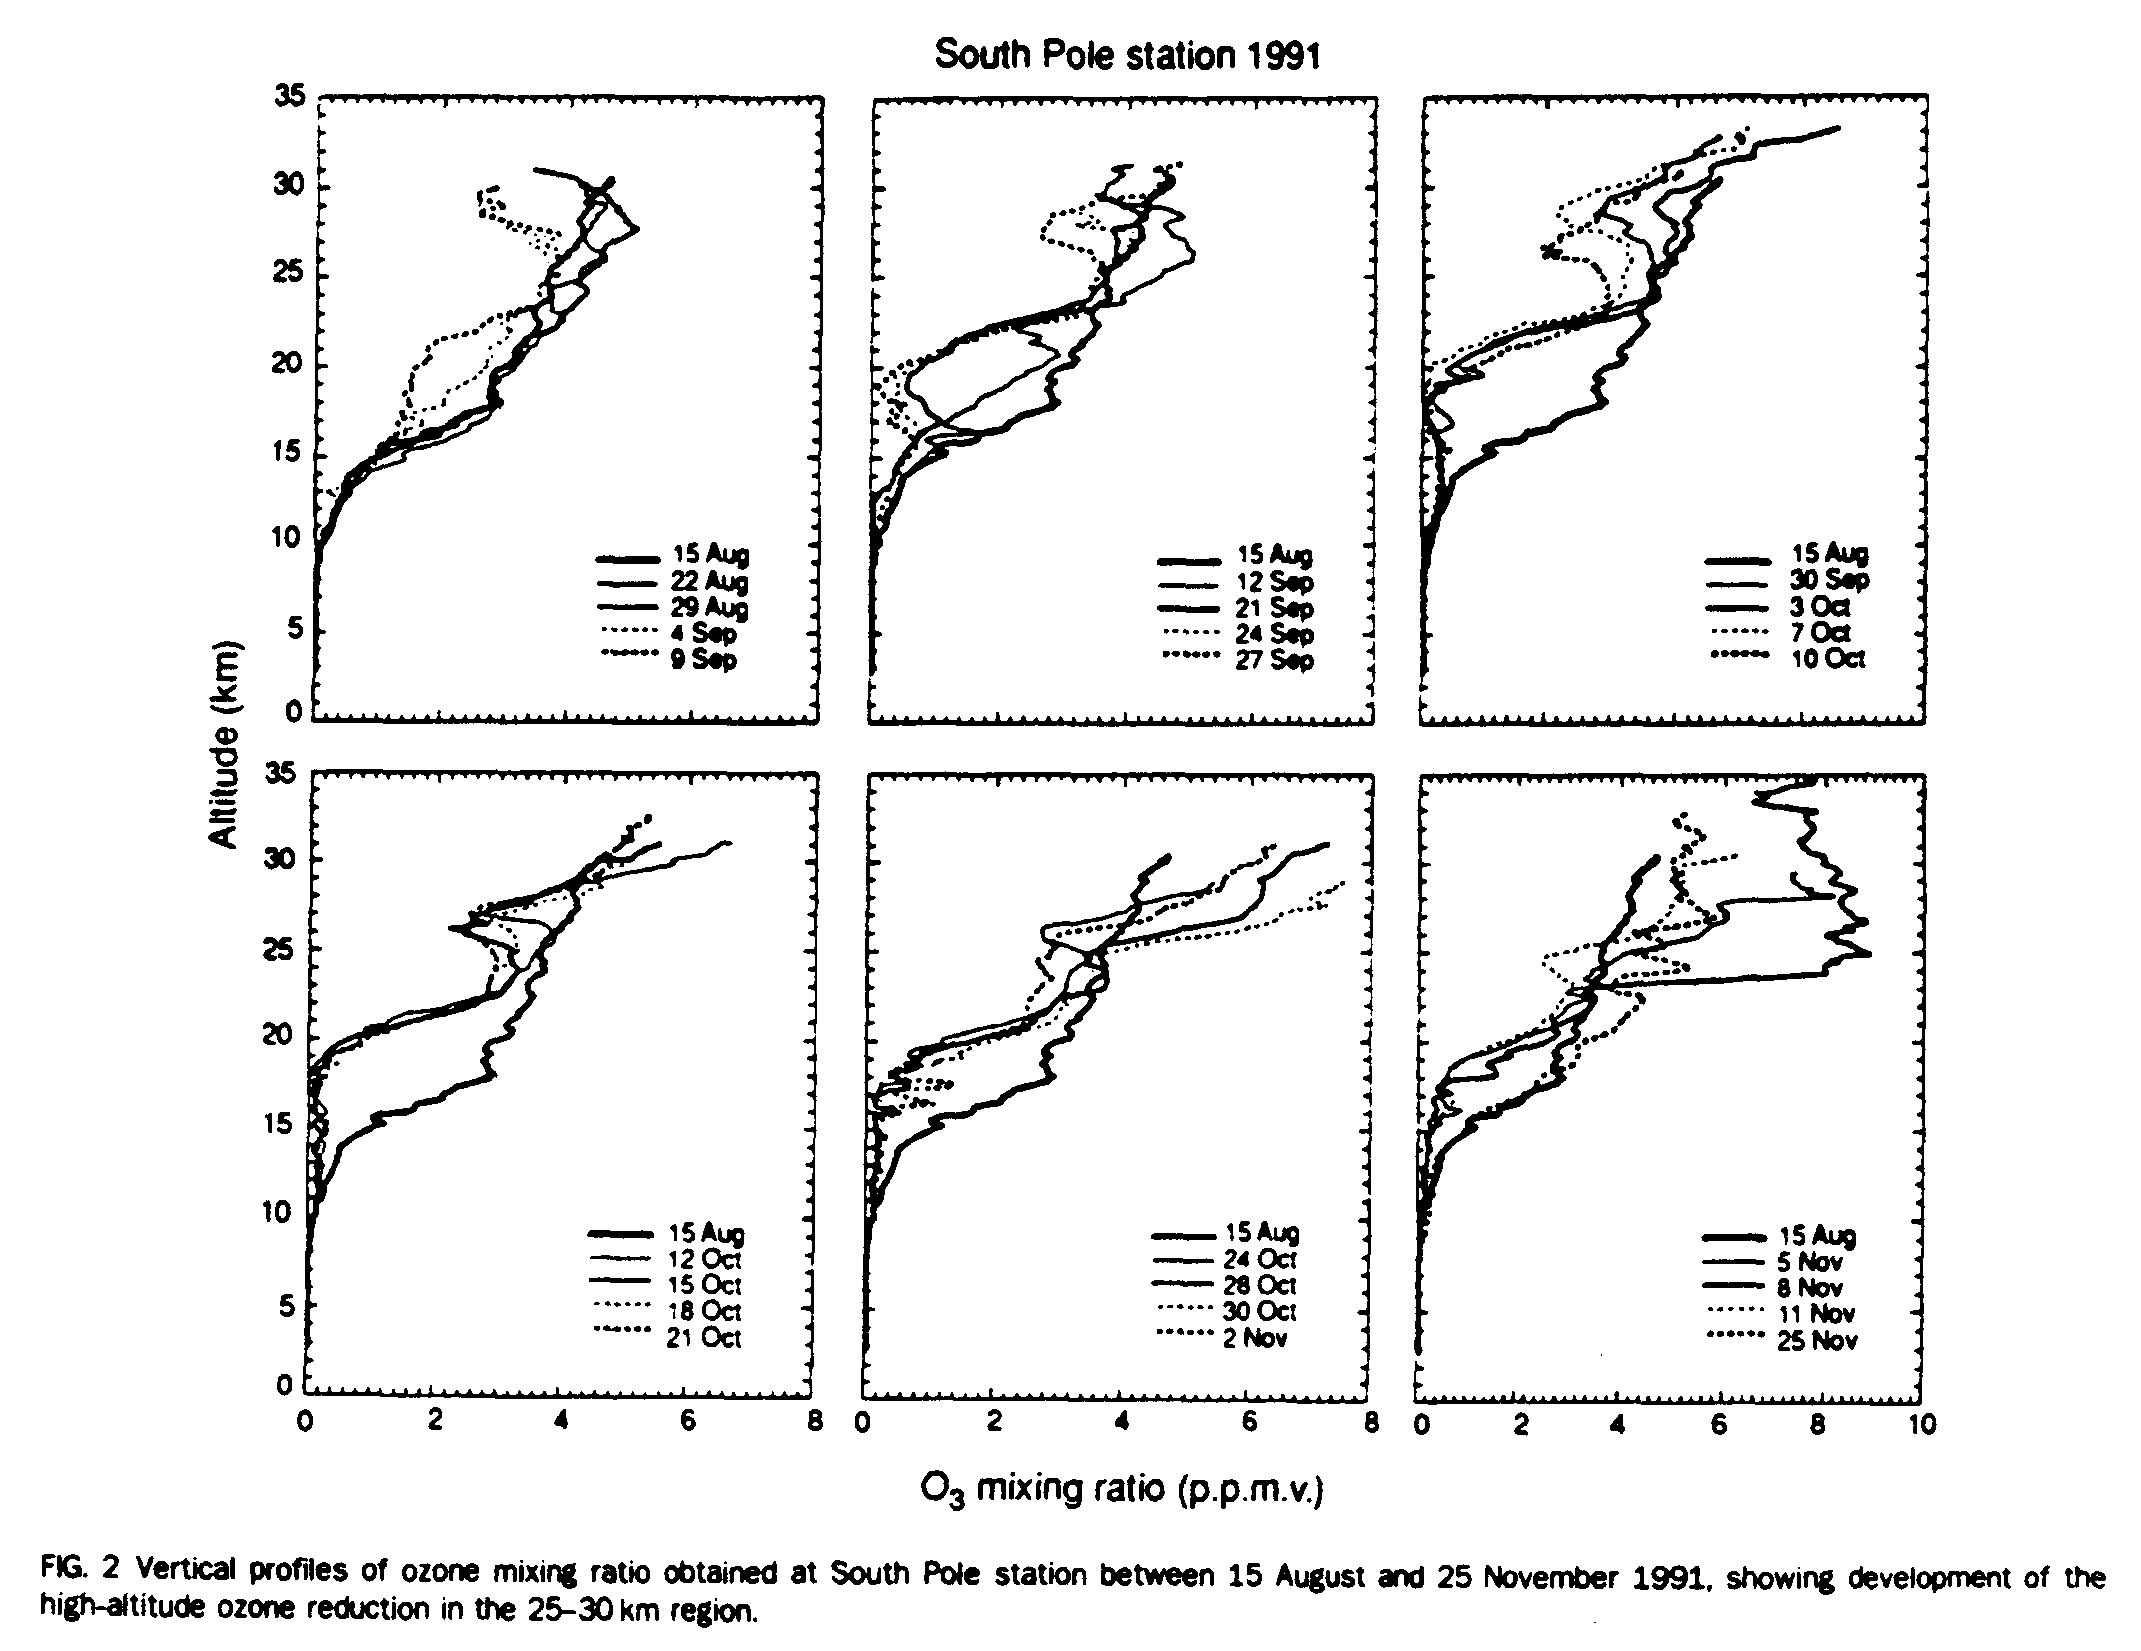
Individual profiles of the ozone mixing ratio for all soundings at South Pole between 15 August and 3 November, shown in Fig. 2, indicate that high-altitude (25-30 km) ozone reductions, 30-50% below the normally constant mixing ratio in this region, began on 4 September and were observed to some extent on every sounding within the vortex thereafter. Because of the position of the high-altitude ozone minima coinciding with the maximum altitude obtained on 4 and 9 September, the extrapolation for total ozone was done at a lower-than-normal mixing ratio and thus the total ozone values for these days are probably underestimated.
Transport of mid-latitude ozone to the south polar region at high altitudes, as expected during vortex breakup in late October and early November, is also apparent in Fig. 2. Beginning about 5 November, the vortex distorted and shifted substantially towards east Antarctica so that ozone concentrations typical of extra-vortex air were present over the South Pole down to ~23 km (see ozone profile of November 8 in Fig. 2). The vortex centre then shifted back towards the South Pole and the ozone profile on 11 November again showed the high-altitude minimum, indicating that it was a characteristic feature of the vortex.
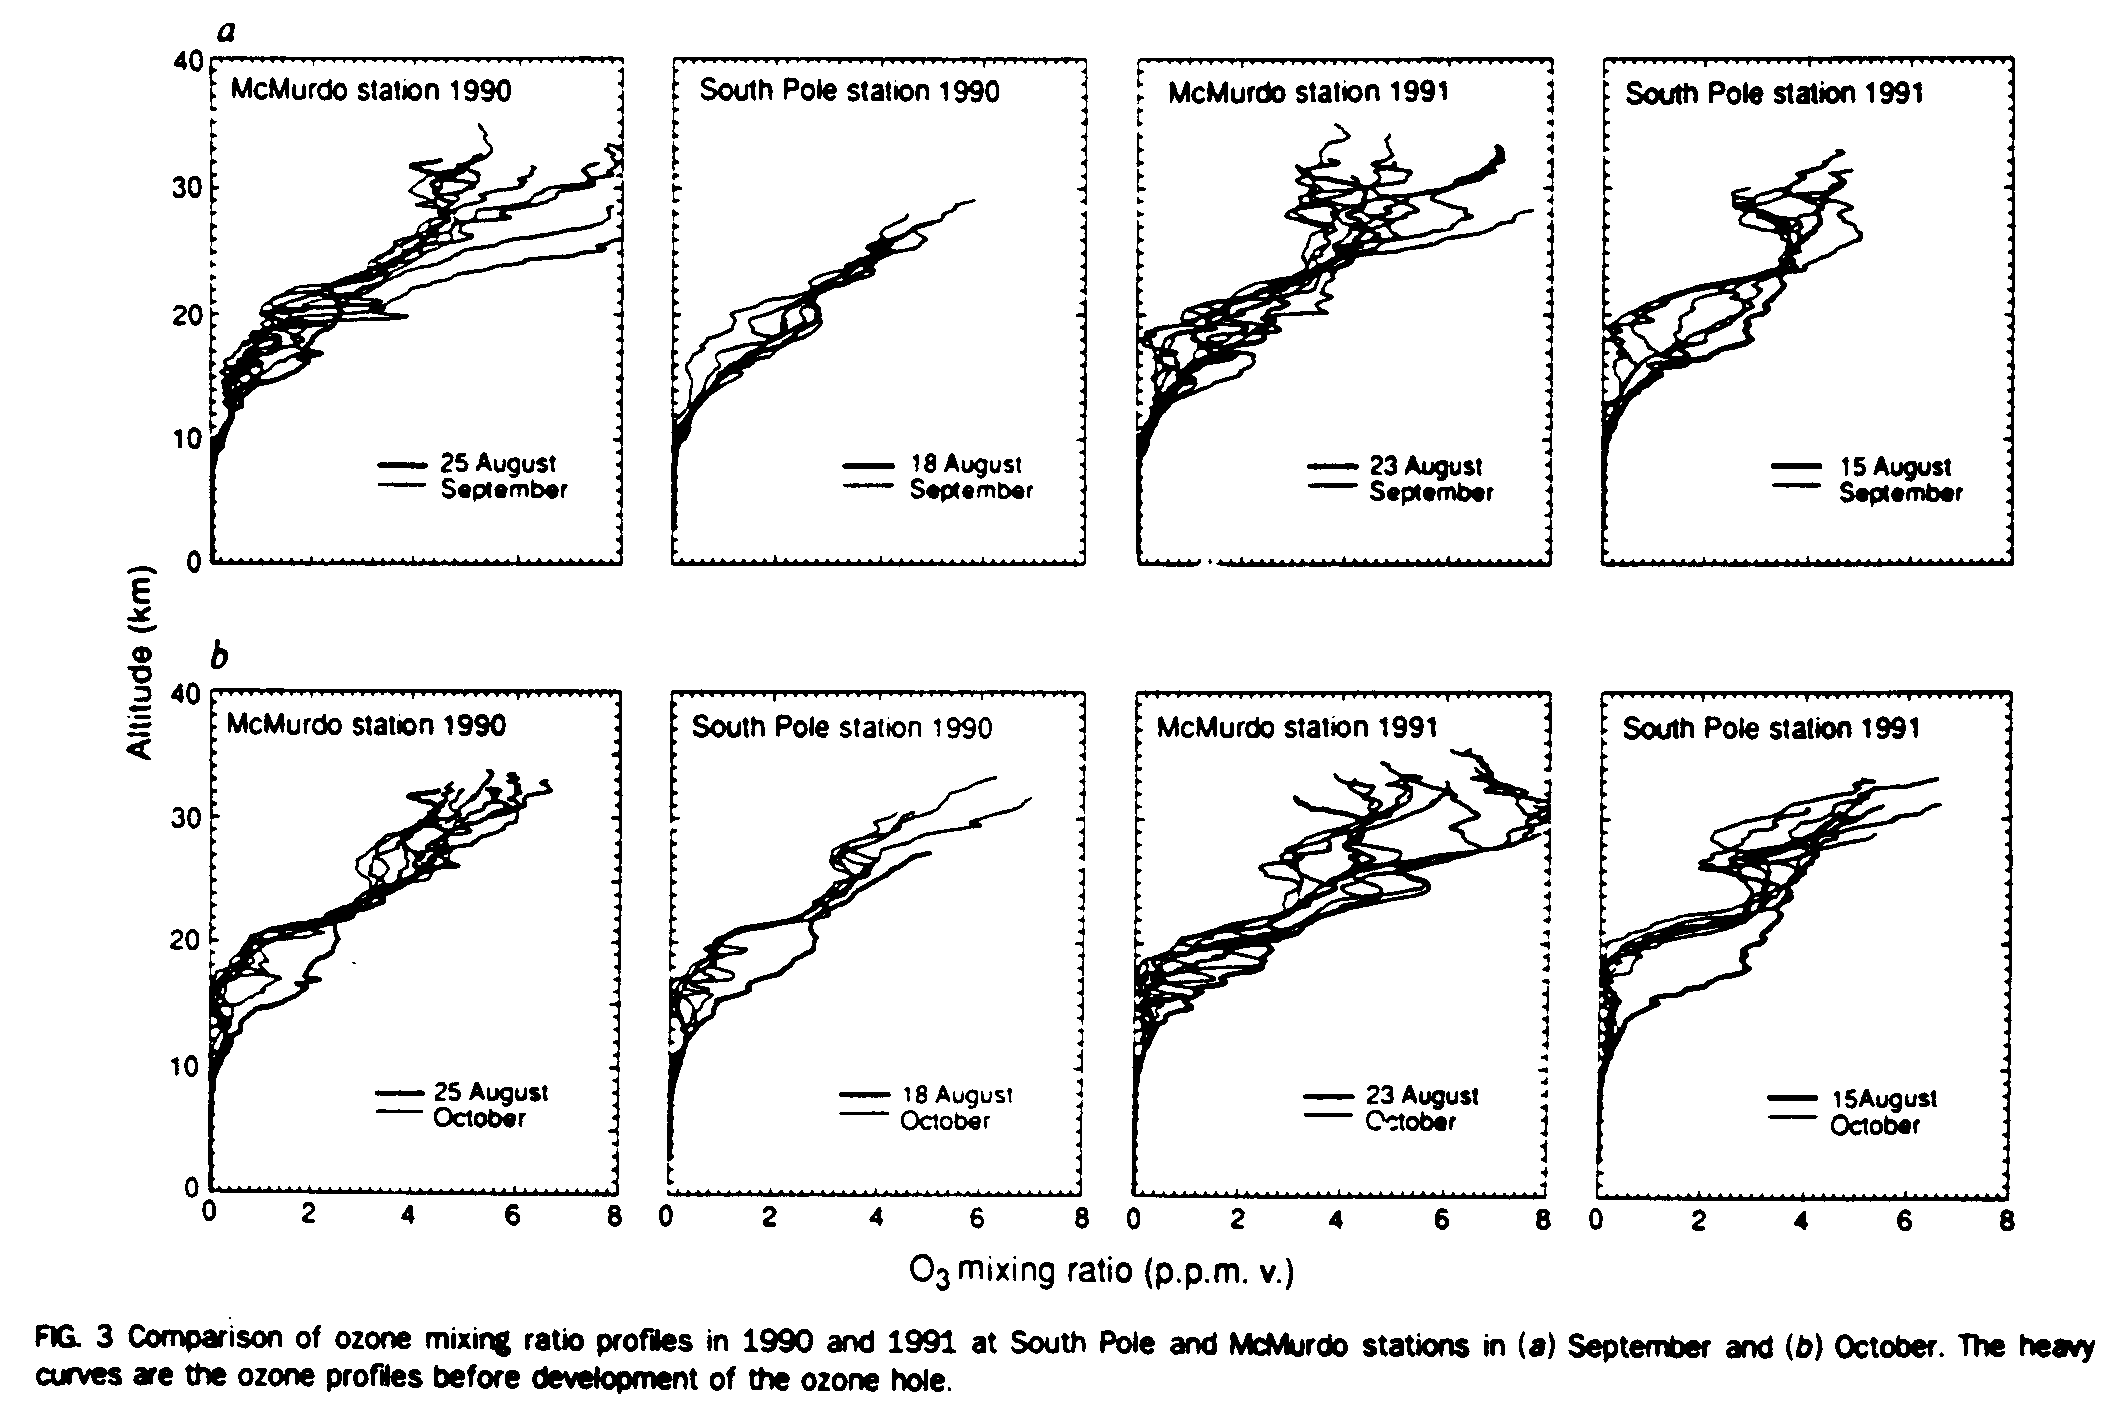
Ozone soundings were conducted at McMurdo between 23 August and 1 November in 1991. Figure 3 compares the 1991 McMurdo and South Pole soundings in September (Fig. 3a) and October (Fig. 3b) with those obtained in 1990. Soundings from McMurdo when the vortex boundary was near, for example from 13 to 21 September 1991, are identified by the high values of ozone mixing ratio at high altitude in Fig. 3. Ozone minima in the 27-30 km region, similar to those observed at South Pole, were present during soundings conducted while McMurdo was inside the vortex boundary in 1991, providing important confirmation that this ozone feature extended over much and possibly all of the vortex. Figure 3b indicates that small (~10%) ozone minima were present at 25-28 km in October at both South Pole and McMurdo before 1991.
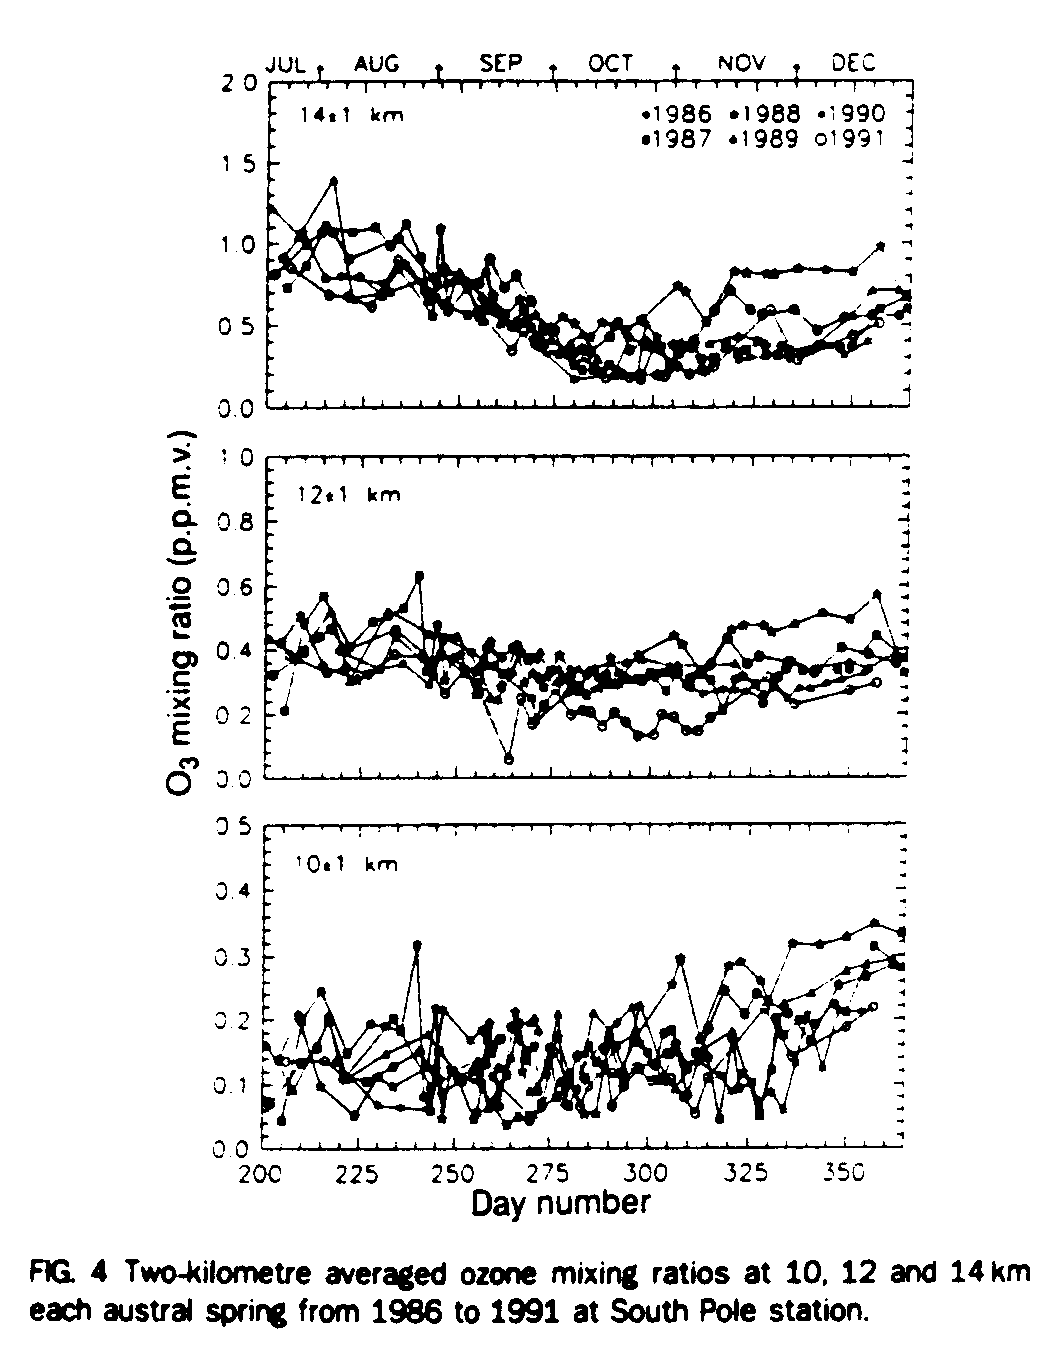
Another unusual ozone depletion phenomenon, observed in 1991, is demonstrated in Fig. 4 at South Pole station where mixing ratios at 10, 12 and 14 km averaged over 2-km intervals are compared with measurements of the previous five years. The small ozone layer below the main ozone hole, which in the past has been characterized by mixing ratios of ~0.3 - 0.4 parts per 10[6] volume (p.p.m.v.) in the 11-13 km region, began to decrease in late September and reached values 50% below normal in late October. The time constant for ozone reduction was ~40 days, about one-half as fast as the ozone hole development at higher altitude in September. Similar observations were made at McMurdo.
Possible causes of the new depletion
The layered nature of the high-altitude ozone reductions suggests that they may be related to transport processes. Although the upper stratosphere was dynamically active during the period in question, quasi-horizontal transport from a region having ozone mixing ratios as low as 2 p.p.m.v. in the 27-30 km region is highly unlikely because ozone mixing ratios are larger at lower latitudes in this altitude region. To account for these low ozone values, downward motions would have to originate at 50-55 km, begin in early September and be unusually severe in 1991. Thus, the high-altitude ozone minima seem to represent an ozone loss. Unusually low ozone in the 11-13 km region can, in principle, result from upward motions of tropospheric air of low ozone content. For example, the unusually low ozone in the 11-15 km region on day 264 (21 September) in Fig. 4 was caused by a 2-km upward motion in association with a major vortex perturbation. Such motions were not, however, present thereafter. Similarly, transport from the tropics, where this altitude region would be in the troposphere, could account for the unusually low ozone.
Study of isentropic back trajectories from South Pole on the 330-340 K (~12 km altitude) and 700-800 K (26-28 km) surfaces, using the European Centre for Medium-range Weather Forecasting gridded analysis, reveals the following. In the 12 km region, the trajectories during the low-ozone period are generally confined to the vortex, verifying that the phenomenon is peculiar to the vortex at this time. At 26-28 km, all days that indicated an ozone deficit in this region had trajectories which reached the coast in 1-2 days, generally in the Wedell Sea area. Those days with minimal or no ozone deficits had trajectories generally over east Antarctica in the 3-4 days before arriving at South Pole. Those with high ozone values, indicating extra-vortex air, had trajectories which extended north of 60deg.S, as expected. These calculations suggest that the source of the low ozone values at high altitude is in the coastal Wedell Sea/Palmer Peninsula area and thus could be related to PSCs which may have been generated by mountain lee waves in this region earlier. But such activity would have to have been much stronger in 1991 than in previous years.
Current theory of springtime Antarctic ozone depletion requires the presence of PSCs, consisting of both ice and nitric acid trihydrate (NAT) particles, for the heterogeneous chemical conversion of inactive chlorine-bearing molecules into active forms and for the suppression of reactive nitrogen (see Solomon[5] for a review of these processes). Temperatures at South Pole reached minima of about -90 deg.C in the 20-24 km region from mid-July to mid-August in 1991 and were below the frost point during this period at altitudes below ~24 km, and below the NAT existence temperature below ~26 km, for maximum pre-winter H20 and HNO3 vapour mixing ratios of 5 p.p.m.v. and 10 p.p.b.v. (parts per 10[9] volume), respectively. Thus, PSCs composed of ice or NAT would not have formed above these altitudes. Satellite limb-scanning extinction measurements cannot observe PSCs poleward of ~80deg. latitude, but lidar observations at South Pole (G. Fiocco, personal communication) and backscattersondes[6] flown to 25 km on several occasions during the winter of 1991 at South Pole did not reveal the presence of extensive PSCs above the typical 12-22 km altitude range (J. Rosen, personal communication). It may be possible that there were unusually low temperatures at 25-30 km over other locations in Antarctica and that transport brought air depleted in ozone to the South Pole and McMurdo at these altitudes. An unusual PSC-related source for the high-altitude ozone reductions therefore cannot be ruled out.
Because ozone removal at 30 km may occur through homogeneous chemistry, we reinvestigated gas-phase ozone removal over South Pole for 1990 conditions and compared them to 1980, using a photochemical model[7]. Preliminary calculations indicate that for 1990 chlorine concentrations, homogeneous chemistry results in at most a 10% reduction in ozone at 30 km compared with 1980. Thus, for the high-altitude ozone losses observed in 1991, at most one-quarter of the deficit could be caused by gas-phase chemistry. The smaller reductions observed at high altitude in October 1990, however, may have been the result of such a process.
The new ozone losses observed in Antarctica in 1991 may also be the result of heterogeneous chemistry on particle surfaces other than those presented by PSCs. The observation that ozone is decreasing in the lower stratosphere at a rate faster than expected for homogeneous chlorine-related processes has led to considerable interest in whether the global stratospheric aerosol layer, composed of aqueous H2SO4/H2O droplets, can affect ozone through heterogeneous processes. Eruptions of Mount Pinatubo in the Philippine Islands on 15-16 June 1991 resulted in a highly enhanced aerosol layer, predominantly in the 22-26 km region, which was at least as large as that observed after the eruption of El Chichón and probably larger[8]. Within six weeks of the eruption, over 95% of the Pinatubo aerosol particles that appeared at northern mid-latitudes were aqueous H2SO4/H20 droplets[9,10]. During the period 12-l5 August, Mount Hudson (46deg. S) in Chile erupted, injecting an SO2 cloud into the lower stratosphere[8].
On the basis of measurements of the total surface area and H2SO4, fraction of the stratospheric aerosol after the 1982 eruption of El Chichón, and the heterogeneous reaction probabilities of N2O5 and ClONO2 with H2O on the surface of the volcanic aerosol, Hofmann and Solomon[11] estimated that ozone reductions of ~15% could have occurred in the 20 km altitude region at northern mid-latitudes during the winter of 1982-83. These results are in agreement with subsequent model studies[12] and observations[13] and it is generally believed that volcanic aerosols are capable of perturbing the stratospheric ozone layer. The perturbation is enhanced at low temperatures because the water content of the aerosol increases, increasing the probability of ClONO2 reacting with H2O on the surface thereby leading, in the presence of sunlight, to the formation of free chlorine, as occurs in PSC-related reactions.
There is a considerable body of evidence that volcanic aerosol was efficiently transported towards the pole in the Southern Hemisphere stratosphere in mid-1991. The SAGE II satellite aerosol extinction instrument[14], which made observations to 50deg.S, indicated substantial penetration of the Pinatubo cloud to high latitudes in the Southern Hemisphere, especially that portion of the cloud between 21 and 40 km, beginning in mid-July. The Hudson eruption cloud was transported in a southeasterly direction and encircled the Antarctic vortex region below 16 km by September[8]. Lidar measurements at Aspendale, Australia (38deg. S)[15], detected a strong backscatter layer from the Hudson eruption at 12-14 km on 28 August. This layer, in a region where there was essentially no aerosol from the Pinatubo eruption, gave an aerosol backscatter signal more than 5 times that of Pinatubo which had been observed in the 16-26 km region after mid-July.
Column NO2 measurements at Lauder, New Zealand (45deg. S), indicated NO2 depletion beginning in mid-August and reaching a peak of at least 25% below normal in the total column by mid-October[16]. This reduction is likely to be due to heterogeneous processes on the surface of volcanic aerosol particles, probably involving the reaction of N2O5 and H2O. A similar effect was observed at northern midlatitudes during the winter of 1982-83, following the eruption of El Chichón[11].
The presence of high reactive chlorine, combined with sunlight, results in ozone depletion below 20 km as early as mid-August in the 68deg.S region[17], where solar illumination begins earlier than at the pole. Air that had been exposed to the Pinatubo aerosol and had already undergone substantial heterogeneous chemical processing probably surrounded the Antarctic vortex to altitudes in excess of 20 km by mid-August. This suggests that the stratosphere near the Antarctic coast was primed for ozone depletion above the altitudes typically subjected to such loss ( 12-20 km). The fact that the high-altitude ozone minima progressed to lower altitude with time (see Fig. 2) could be interpreted as being due to subsidence of air depleted in ozone which had been transported into the high-altitude vortex in early September. If this were the case, one would expect volcanic aerosol to accompany the low-ozone air.
Lidar observations at South Pole (G. Fiocco, personal communication) do not indicate the presence of enhanced aerosol in late August and early September above 15 km but clearly show high-altitude layers in November. The lidar at Dumont d'Urville (68deg. S) saw an apparently dense volcanic particle layer at 20-23 km on 20 July and more frequent volcanic layers up to 26 km during September, generally when the station was outside of the vortex (L. Steranutti, personal communication). Optical depth measurements at South Pole station (E. Dutton, personal communication) indicate excessive aerosol present on 10 October, the first day with adequate sunlight for measurement. The optical depth reached values in excess of 0.3 in November more than 3 times higher than during the corresponding period following the eruption of El Chichón and similar to values observed for the Pinatubo eruption in the main equatorial layer[8]. Thus, the observations suggest the absence of volcanic aerosol at high altitude in the vortex and its presence in the coastal region in September.
Balloon-borne particle counter measurements to altitudes of 27 km and lidar measurements" were made at McMurdo between 23 August and 13 October, and although no excess aerosol was detected above 20 km, volcanic particle layers were observed in the lower stratosphere as early as 11 September. Stormy weather from 13-23 September, coinciding with a substantial compression of the vortex in the McMurdo region where the polar jet maximum appeared overhead, prevented observations during this period. Large enhancements of aerosol in the 10-14 km region were observed after the September storm and thereafter until the final measurements in mid-October, during periods when McMurdo was well within the vortex[18]. Concentrations of newly nucleated small aerosol (radii ~0.01 um) greater than 6,000 cm[-3] were observed in the volcanic cloud. At these high concentrations, the lifetime for coagulation of these condensation nuclei is only a few days so that the source of the condensing vapours was clearly the Hudson eruption, rather than Pinatubo. As indicated earlier, Pinatubo had little or no effect below about 15 km. Above this altitude, condensation nuclei from the Pinatubo eruption had returned to normal levels by September[18]. The data at McMurdo thus provide strong evidence that the low ozone at 12 km was not the result of unusual intrusions of tropical air but was associated with the volcanic cloud from Mount Hudson.
There was no evidence of temperature increases in this layer that might be the result of aerosol heating and cause vertical motions of the air parcel and thus ozone reductions. At 12 km, the air is 10 times as dense as at 25 km where changes in circulation may take place in response to heating in dense volcanic layers at high altitude in equatorial regions. In fact, modelling of the heating effect of the Pinatubo cloud at 16-28 km predicts upward motions in the equatorial region and downward motions at mid-latitudes, which would tend to decrease and increase ozone, respectively, in these regions[19]. Thus, if any vertical motion were expected south of 30deg., it would be downward with increasing ozone.
The total aerosol surface-area concentration in the Hudson cloud, due mainly to the many freshly nucleated small particles, peaked at 12 km with values as high as 100 um[2] cm[-3], enough to cause substantial heterogeneous chemical perturbations[11]. Temperatures ranged from -68 deg.C at the bottom to -75 deg.C at the top of the layer, too warm for PSCs but dictating a water content of ~40% in the H2SO4/H2O aerosol and thus a relatively high probability for the production of free chlorine through the reaction of ClONO2 and H2O on the surface of the aerosol (reaction probability ~0.003)[20]. But unless the aerosol were frozen, it is unlikely that surface reactions of ClONO2 with HCl, as occurs on ice and NAT particles, would be important. Thus, one would expect the rate of ozone reduction due to volcanic aerosol at these temperatures to be slower than in the case of PSCs. The observation of a slower depletion rate in the volcanic layer than in the normal ozone hole conforms with this expectation. Modelling of volcanic ozone depletion rates[21], although done for higher altitudes, indicates that for this level of volcanic aerosol surface area and reaction probability, ozone should decline at a rate about one-half that experienced in the normal ozone hole region, in agreement with observations.
In summary, loss of half of the Antarctic ozone in the 11-13 km layer during October in 1991 (see Fig. 4) occurs simultaneously with penetration into the vortex of enhanced volcanic aerosol below 15 km. The most plausible explanation of this ozone loss seems to be depletion occurring through heterogeneous chemistry in the volcanic cloud.
Implications for the 1992 Antarctic ozone hole
Concentrations of volcanic H2SO4/H2O aerosol at least 3 times as large as those present after El Chichón have now been incorporated into the 1992 winter vortex. At -80 deg.C, the volcanic aerosol particles will have a water content similar to NAT particles (~50%) but with a total mass possibly 10 times greater. If the volcanic hypothesis proposed here to explain the low ozone at 12 km in 1991 is correct, then ozone reductions could occur during 1992 as early as May, especially in the 70deg. to 80deg. S latitude band where low levels of sunlight coincide with cold temperatures at this time.
The concentration of effective condensation sites for the formation of PSC particles will also be increased during the winter of 1992. This will result in the formation of more numerous but smaller PSC particles for the same amount of condensable mass increasing the surface area available for heterogeneous reactions and increasing PSC lifetimes. Both ice crystals and NAT particles appear at very low concentrations (~0.001-0.005 cm[-3])[22] and thus are believed to form selectively on the larger sulphate aerosol particles (radius >= 0.3 um)[23]. Initial measurements of the Pinatubo aerosol size distribution indicate a stratospheric enhancement of the larger particles by up to two orders of magnitude[9]. For constant condensable mass, particle surface area varies as the 1/3 power of the concentration so that an increase in PSC particle surface area, and possibly heterogeneous chemical effects, from a factor of 2 to a factor of 4 can be expected. Increasing the surface area of PSCs may not substantially decrease the minimum total ozone observed because depletion in the heart of the ozone hole is not limited by available surface area during a normal winter.
Smaller PSC particles have smaller sedimentation velocities and are therefore likely to yield decreased denitrification. The temporary sequestration of odd nitrogen in PSCs (generally referred to as denoxification) will, however, still take place when temperatures are low enough, so that active chlorine levels would remain high so long as PSCs are present. Termination of ozone depletion in the lower stratosphere may occur earlier under these conditions because springtime evaporation of the lingering smaller NAT particles will return HNO3 to the gas phase to be photolysed. A change in the morphology of the ozone hole, including an earlier appearance and expansion of its vertical distribution, can be expected.
Summary and conclusions
Apart from the normal springtime ozone depletion over Antarctica, observed between 12 and 20 km in 1991, there were additional ozone losses of about 50%, compared to previous years, in the upper and lower stratosphere. The impact on total ozone loss was substantial (10-15%), being large enough to account for record lows in total ozone during late September at South Pole station in 1991 and to contribute towards the depth of the ozone minimum in early October. The upper stratospheric ozone loss occurred in the 25-30 km region, was observed to develop in early September and became a stable feature of the south polar vortex in 1991. About one-fifth of this loss seems to have been present in previous years and may be related to homogeneous chemistry. The remainder seems to be associated with transport of air depleted in ozone by heterogeneous processes.
Ozone losses of ~50% in the 11-13 km region began in late September. This ozone loss in the lower stratosphere is believed to be a new phenomenon peculiar to the 1991 polar vortex and its relationship to volcanic activity in 1991 has been examined. The presence and timing of what is believed to be aerosol from the Mount Hudson eruption at 11-14 km, coincident with the unusual ozone loss in this region at both South Pole and McMurdo, represents what we believe to be the strongest evidence for heterogeneous ozone loss in association with volcanic aerosol obtained to date. In 1992, volcanic aerosol will have been trapped in the winter vortex, The observations of new ozone depletion in the Antarctic lower stratosphere presented here, and the volcanic hypothesis proposed to explain it, predict that the volcanic aerosol could cause ozone depletion in Antarctica this austral fall as well as adding to the normal PSC-related springtime depletion. In addition, the volcanic aerosol particles, acting as condensation sites for PSC formation, are likely to alter the ozone hole morphology in 1992.
Received 5 December 1991, accepted 12 August 1992
ACKNOWLEDGMENTS. We thank J. Lowell and M. O'Neill for conducting the soundings at South Pole, T. Thompson and L. Womack for assistance at McMurdo, G. Olson and J. Lathrop for instrument preparation and data reduction. A. Tuck for discussions and NSF Division of Polar Programs for financial and logistic support.
1. Garcia, R. R. & Solomon, S. Geophys. Res. Lett. 14, 848-851 (1987).
2. Angell, J. K. Geophys. Res. Lett. 17, 1569-1572 (1990).
3. Komhyr, W. D., Oltmans, S. J., Grass, R. D. & Leonard, R. K. Can. J. Phys. 69, 1093-1102 (1991).
4. Hofmann, D. J., Harder, J. W., Rolf, S. R. & Rosen, J. M. Nature 326, 59-62 (1987).
5. Solomon, S. Nature, 347, 347-354 (1990).
6. Rosen, J. M., Kjorne, N. T. & Oltmans, S. J. Geophys. Res. Lett. 18, 171-174 (1991).
7. Garcia, R. R. & Solomon, S. J. geophys. Res. 88, 1379-1400 (1983).
8. Smithsonian Institution Bull. glob. Volcanism Network 16, No. 7, 8, 9, 10 (1991).
11. Hofmann, D. J. & Solomon, S. J. Geophys. Res. 94, 5029-5041 (1989).
12. Brasseur, G. P., Granier, C. & Walters, S. Nature 348, 626-628 (1990).
13. Jager, H. & Wege, K. J. atmos. Chem. 10, 273-287 (1990).
14. McCormick, M. P. & Veiga, R. E. Geophys. Res. Lett. 19, 155-158 (1992).
17. Tuck, A. F. J. geophys. Res. 94, 11687-11737 (1989).
18. Deshler, T. et al. Geophys. Res. Lett. (in the press).
19. Brasseur, G. & Granier, C. Science (in the press).
20. Hanson, D. R. & Ravishankara, A. R. J. geophys. Res. 96, 17307-17314 (1991).
21. Prather, M. J. Geophys. Res. 97, 10187-10191 (1992).
22. Hofmann, D. J. & Deshler, T. J. geophys. Res. 96, 2897-2912 (1991).