Land Quality Indicators for Sustainable Land Management:
Yield Gap
P.S. Bindraban1, D.M. Jansen2, J. Vlaming2, J.J.R. Groot1
1 Research Institute for Agrobiology and Soil Fertility (AB-DLO)
P.O. Box 14, NL-6700 AA Wageningen, The Netherlands.
2 The Winand Staring Centre for Integrated Land, Soil and Water Research (SC-DLO)
P.O. Box 125, NL-6700 AC Wageningen, The Netherlands
(Edited by Julian Dumanski, RDV, World Bank)
Many processes affect crop performance, but relatively few have a major impact: the conservative efficiency of the use of radiation, water and nutrient on crop growth (Monteith, 1990; Sinclair, 1990), those contributing to the soil water balance and those affecting soil fertility. Crop growth has been modelled successfully as a function of environmental factors using the concept of these conservative efficiencies (Bindraban, 1997). Generic descriptions of soil water dynamics for generalised soil profiles allow good estimates of water availability. Nutrient availability can be assessed through transfer functions and expert judgement from soil characteristics. Crop production will be described for these levels in terms of potential and water- or nutrient limited production (Figure 1). The most suitable cereal crop (depending on the agro-ecological conditions wheat, rice, maize, millet or sorghum) is taken as a proxy for a wide range of crops that could be grown, with yields expressed in 'grain equivalents'. In practice actual production levels may differ from these calculated levels due to deviant agricultural management. Actual yield is a function of biophysical as well as the socio-economic conditions
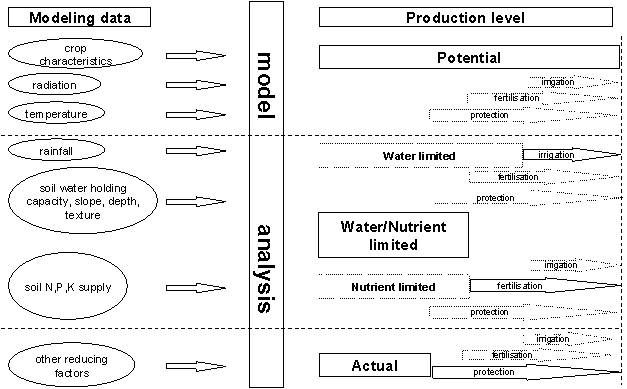
Figure. 1. Levels of production and required data for its assessment. (Modified from Rabbinge, 1993)
Potential production (YM) Crop production under optimum management conditions is determined by absorbed photosynthetically active radiation. The foliage of the crop determines which fraction of the daily radiation is absorbed. This absorbed radiation is converted into biomass with a crop specific conversion efficiency (Monteith, 1990). Growth is calculated on a daily basis for the duration of a growing period by a simple deterministic simulation model. Temperature drives crop phenological development and therefore determines the growth duration. The length of growing seasons is determined by temperature at which growth is feasible. Multiple cropping is allowed when permitted by climatic conditions. Daily or monthly data on radiation and temperature are required to assess this production level.
Water limited production. The necessary amount of water to fulfil transpiration requirements for crop growth under optimum management conditions, can be calculated on the basis of crop specific transpiration coefficients (Monteith, 1990). When water supply through rain or irrigation is insufficient, soil water content may fall below a threshold and actual crop transpiration becomes less than potential, proportionally decreasing crop growth. Water availability to the crop is estimated with a capacity type, dynamic soil water model. Infiltration depends on the soil-specific infiltration capacity, the amount and intensity of rainfall and the slope of the terrain. Drainage occurs when field capacity is exceeded and the soil specific capacity rate allows drainage. The water-holding capacity of soils is related to soil texture. Soils are variable in depth. Nutrient availability is assumed not to limit crop growth at this production level. Required data to assess this production level, in addition to radiation and temperature, are rainfall and physical characteristics of the soil concerning infiltration and drainage of water, water holding capacity and slope.
Nutrient limited production. A quantitative evaluation procedure of the native fertility of soils is available that interpret soil fertility as the capacity of a soil to provide plants with nitrogen, phosphorus and potassium (Janssen et al., 1990). The potential supply of N, P and K from the soil is estimated from a set of chemical properties of the soil. The actual uptake of each nutrient is estimated, taking into account the potential supply of the other nutrients. Subsequently, a nutrient limited yield is determined on the basis of the actual uptake of the nutrients. Required data to assess this production level are the soil chemical characteristics, organic matter, pH, P-Olsen and exchangeable K.
Baseline productivity (YL) The lowest of water limited and nutrient limited yield level forms the baseline of the land based natural resource production capacity. This level of production can be obtained with proper management but without input of nutrients and water.
Actual yield levels (YA) Actual yield levels are not only influenced by land based natural resources, but also, and often even stronger, by socio-economic conditions. Cultivation practices are based on farmers knowledge and skills, access to markets, land tenure etc. These practices may not meet the agronomic conditions needed to realise potential yield levels for prevailing eco-physiological conditions. Yields may differ for a multitude of reasons, resulting in sub-optimal use of land resources or even deteriorating the resource base. Actual yields may range from zero to potential.
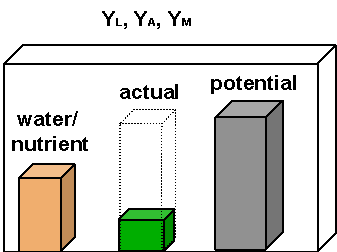
Figure 2. Visualisation of the three yield levels distinguished to define the yield gap land quality indicator.
Yield and yield gap indicators. Both the absolute yield levels, as well as their absolute and relative differences need to be considered in defining the yield gap LQI. The LQI (Table 1) should relate the actual yield (YA) to both the potential (YM), and the baseline yield (YL), and should be indicative for possibilities to improve production. The difference between the actual and baseline yield indicates to what extent additional external inputs ought to be applied to realise the yield that is actually obtained. The difference with the potential yield indicates options to further increase yield. Moreover, the difference between the potential (YM) and the baseline yield (YL) indicate a biophysical yield gap typically revealing technically feasible options to increase yield. These yield gaps are visualised in Table 1.
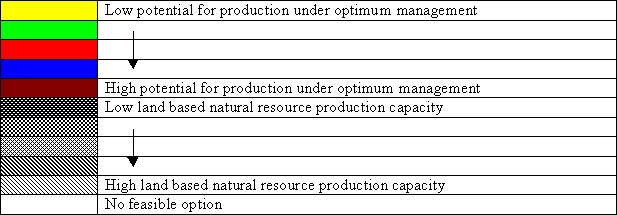
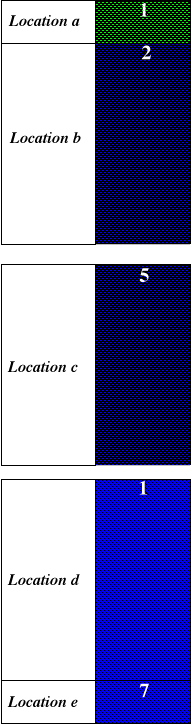
Table 1. Yield Gap LQI indicating options to improve yield. Actual yields (YA) are given as a value in the block, with the potential (YM) and the baseline yield (YL) indicating biophysically determined yield levels (ton ha-1 jr-1).
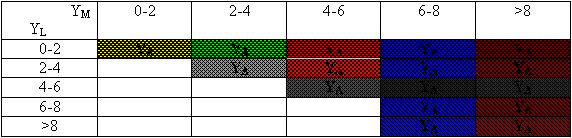
The following examples clarify the interpreted of the table. An actual yield of 1 ton ha-1 in location "a" indicates that little additional inputs are needed to realise this yield. However, it does not indicate whether the soil is being depleted or not. Also, it can be deduced that there is little scope to further increase yield. In location "b" not much external input may be needed, but there is much more scope for yield increase. In location "c" much external inputs ought to be applied, while scope for further yield increase is limited. Yields could be increased substantially in location "d" without increasing external input. In location "e" high yield might be obtained with sufficient external input or with insufficient external inputs in which case the system is likely to deplete the natural resource base. In any case there is hardly any scope for further yield increase.
Data on weather, soil, crops and crop management is required for the calculation of the various yield levels and the nutrient flows. Not all required data may be readily available in existing databases. Interpolation, generation, transfer functions and expert knowledge need to be applied to derive required data. Required data and databases from which the LQIs may be derived are given in the table below.
Table 4. Required data for the calculation of land quality indicators yield gap and soil nutrient balance and data sources at a national level.
|
Weather |
Soil |
Land cover/use |
||||
| (i) Databases |
Leemans and Cramer (1991) Muller (1996) |
FAO /Unesco (1996) Batjes (1997) |
||||
|
Yield gap |
Nutrient balance |
Yield gap |
Nutrient balance |
Yield gap |
Nutrient balance |
|
| (ii) Data | ||||||
|
Monthly temperature; min/max |
D | |||||
|
Daily radiation |
I |
|||||
|
Daily temperature |
I |
|||||
|
Monthly rainfall |
D | |||||
|
Daily rainfall |
G |
|||||
|
Texture |
D |
D |
||||
|
Slope |
D |
D |
||||
|
Soil depth |
D |
D |
||||
|
Drainage |
T |
D |
||||
|
Soil water holding capacity |
T |
|||||
|
Soil organic C |
T |
T |
||||
|
CEC |
T |
|||||
|
P-Olsen |
E |
E |
||||
|
P-fixation |
T |
|||||
|
Exchangeable K |
E |
E |
||||
|
PH |
T |
|||||
|
Agricultural land |
D |
D | ||||
|
Land use |
D |
|||||
|
Fertilizer use |
E |
|||||
|
Actual yield levels |
D |
D/E |
||||
D=Directly obtained, I=Interpolated, G=Generated, T=Transfer, E=Estimated
Weather data will be obtained from the database of Leemans and Cramer (1991), containing monthly data on cloudiness, average temperatures and precipitation. Radiation will be derived from cloudiness. Daily radiation and temperature data will be obtained by linear interpolation of monthly values, which are assigned to the middle of the month. The database of Müller (1996) will be used for the monthly average number of raindays. Daily rainfall is obtained by a random distribution of the average monthly rainfall over the average monthly number of raindays (Van Diepen et al., 1988).
The FAO/Unesco soil database (FAO, 1996) will be used, where 4932 different soil map units are distinguished. Slope, texture and depth are directly obtained the soil water holding capacity is derived from these characteristics (Batjes, 1997), to determine the availability of water to the crop. Soil chemical characteristics have also been related to soil map units using the WISE-database (Batjes, 1997). Soil nutrient availability can either be directly obtained from this source or derived using transfer functions.
The FAO provides data on production areas, yields, fertiliser inputs and agro-climatic maps that are used for the calculation of the NSNB at higher scale levels. At lower scale levels, national databases can be used to fulfil the data requirements. The quality and amount of data varies per country. As a result the level of detail in the procedure that can be reached is highly variable.
To address the spatial aspect of the LQI, yield levels are calculated for the smallest homogeneous unit. Data may have to be aggregated or dissaggregated to obtain required characteristics for a unit. Depending on the type of data, weighing procedures can be applied for aggregation purposes. For analysis on a grid basis, interpolation techniques are required to assign values for parameters to areas between observation points, like meteorological stations.
DISCUSSION
The presented methodology for the calculation of yield-gaps and nutrient budgets aims to extend knowledge and information from micro and site-specific level to practical and generally applicable indicators at various scales. A description of the agricultural production system has been explicitly defined. This description governs the calculation procedure, which has been simplified to deal with all scale levels, but remains a holistic, systems analytical approach. Necessary data, even at higher spatial scales, can be found in existing databases. Lack of data should not withhold us from attempting to assess LQI’s. Various steps in the methodology require the conversion of generalised and often qualitative data into quantitative data.
Yield-gaps and nutrient budgets are indicative, and should not be seen as hard data. The use of the system analytical approach, even with very crude input data, is justified as long as the quality of output data is evaluated in the results for instance through the assessment of error ranges. Although this might diminish scientific accuracy, the objectivity of the procedure is maintained as long as assumptions are explicitly made in the calculation procedure to allow updating and upgrading of the procedure.
This approach reveals gaps in our knowledge, and more importantly, indicates what type of quantitative data is strongly needed. Approaches that uses the availability of data as starting point lack this strong ability to indicate knowledge and data gaps.
The methodology should also allow comparison between agro-ecological zones. Various crops can be grown on numerous ways on agricultural land. Comparison in terms of production capacity is only possible when expressed in one general term. Cereal grain equivalent is most suitable, as many species can grow on the major part of the agricultural land, and because of the importance for human consumption. For similar reasons grain equivalents have also been used in other studies (WRR, 1995). Grain equivalents facilitates comparison between zones, but cereal performance might distort options for improvement when the main agricultural production concerns crop strongly differing from cereals like tree crops or cash crops such as coffee and tea.
The gap in yield between actual and potential yield indicates the impact that efforts to improve the land quality can have on productivity increase, but does not indicate the required inputs in terms of the factors water and nutrients. A large yield gap does not necessarily indicate a good return of investment. It is therefore important that estimates are made of the required amount of input of the factors water and nutrients that are required to increase yield. Our procedure inherits the possibility to assess the impact of management practices on nutrient budgets and land productivity.
The gap in yield between actual and baseline yield should be carefully interpreted. Actual yields below the baseline could indicate sub-optimal use of natural resources, and soil nutrient depletion could range from none to severe. However, soils may even be enriched when external inputs are applied. Actual yields exceeding the baseline do not necessarily indicate that natural resources are overexploited. External inputs may be sufficiently supplied to the production system. This environmental aspect can be further investigated by assessment of an additional yield level that is determined by the land based resources, supplemented with external inputs of nutrients and water under proper management (Fig. 4). Any gap occurring with actual yield are more realistic indicators for the sustainability of the actual production system. Actual yield being less than these input-yields, e.g. due to disease infestation or other improper management, could indicate an enrichment of soils, or a heavy environmental load caused by loss of nutrients. An integrated analysis of yield gaps and nutrient balances could indicate which process is likely to occur. A challenging option for future analyses.
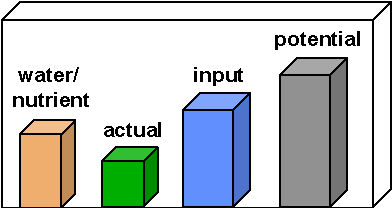
Fig. 4. Three yield levels distinguished to define the yield gap land quality indicator. A forth level (input) indicates the yield that could be obtained with actual external input of nutrients and/or water under proper management.
Pests, diseases or weeds can reduce crop performance at all levels. The impact of biotic stresses ranges from very heavy to virtually non-existent, depending on environment and management practices. As these biotic stresses are not necessarily land-related, they are not considered in the definition of the land quality indicator yield gap. Interaction effects between water and nutrients have not been considered in the analysis. Some overestimates may result from this simplification.
Land quality indicators that are not confounded with social-economic constraints reveal which are promising areas to obtain increase in yield. Production capabilities can be determined for various levels of management differing in irrigation, fertilisation and crop protection. Availability of geo-referenced data makes it possible to indicate these options on regional basis. Caution is needed when data is aggregated. Yield gap indices assessed at a grid cell resolution allow visualisation of regional differences within countries. Averaging yields at country level will conceal these differences and hence opportunities for improvements. Ideally, comparison with actual yield levels should be done at the same resolution as for the calculation units. Country average yield data are comparably non-informative to indicate options for improvements, while data on actual yield levels will not be available at the required resolution. Overlays of actual and attainable yield levels need to be made on the basis of intelligent choices on the homogeneity of regions for a required purpose. Comparisons at the level of agro-ecological zones will more realistically reveal options for improvements. Therefore, unambiguous definitions of agro-ecological zones should be formulated and data should be collected and made available at this level.
An example of a global database, (GLASOD), provides estimates of human-induced soil degradation over the past 5 to 10 years on the basis of expert-judgement. These estimates are qualitative and their reliability is rather limited (Oldeman et al, 1991). A disadvantage of this approach is that it does not allow extrapolation into the future and it is not feasible to impose management options to analyze their impact on future degradation rates and changes in land quality. The combination of the proposed process-based approach on assessment of the production capacity of land and the nutrient balance approach has the possibility to analyze the impact of management scenarios on land quality. Uncertainties in our current assessments, to a major extent caused by poor data quality, do not allow analyses for a long term. At present insufficient information and knowledge is available to accurately quantify long term changes in land quality.
References
Alexandratos, N., 1995. World Agriculture: Towards 2010. FAO/John Wiley.
Batjes, N.H., 1997. A world dataset of derived soil properties by FAO-UNESCO soil unit for global modeling. Soil Use and Management 13, 9-16.
Bindraban, P.S., 1997. Bridging the gap between plant physiology and breeding. Identifying traits to increase wheat yield potential using systems approaches. PhD-thesis, Wageningen Agricultural University, The Netherlands.
De Wit, C.T., H. Huisman and R. Rabbinge, 1987. Agriculture and its Environment: Are There Other Ways? Agricultural Systems 23: 211-236.
DeFour, T., S. Kanté, T. Hilhorst, and H. De Groote, 1996. Towards more sustainable soil fertility management. Agricultural Research and Extension Network.
FAO, 1996. Digital soil map of the world and derived soil properties, version 3.5, November 1995, derived from the FAO/UNESCO soil map of the world, original scale 1:5 000 000. CDROM, FAO, Rome.
Goudriaan, J., J.J.R. Groot and P.W.J. Uithol, 1998. Primary productivity of agro-ecosystems. In: H. Mooney, B. Saugier and J. Roy (Eds.). Terrestrial Global Productivity. Proceedings IGBP-workshop, Montpellier, France, March 20-22, 1997. In press.
Huang, J., 1997. Agricultural development, policy and food security in China. In: P.W.J. Uithol and J.J.R. Groot (Eds.), Proceedings Workshop Wageningen-China, AB-DLO Wageningen. pp. 3-38
IFPRI, 1994. World food trends and future food security. Food Policy Report. The International Food Policy Research Institute, Washington, D.C. 25p.
Jansen, B.H., F.C.T. Guiking, D. van der Eijk, E.M.A.. Smaling, J. Wolf and H. van Reuler, 1990. A system for quantitative evaluation of the fertility of tropical soils (QUEFTS). Geoderma 46: 299-318.
Leemans, R. and W. Cramer, 1991. The IIASA database for mean monthly values of temperature, precipitation, and cloudiness on a global terrestrial grid. Report RR-91-18. International Institute of Applied Systems Analysis (IIASA), Laxenburg, Austria.
Monteith, J.L., 1990. Conservative behavior in the response of crops to water and light. In: R. Rabbinge, J. Goudriaan, H. Van Keulen, F.W.T. Penning de Vries and H.H. van Laar (Eds.) Theoretical production ecology: reflections and prospects, Simulation Monograph 34, Pudoc, Wageningen pp 3-16.
Müller, M.J., 1996. Handbuch ausgewählter Klimastationen der Erde. 5. ergäntzte unde verbesserte Auflage. Forschungsstelle Bodenerosion Mertesdorf (Ruwertal), Universität Trier, Gerold Richter, Trier.
Oldeman, L.R., R.T.A. Hakkeling and W.G. Sombroek, 1991. World map of the status of human-induced soil degradation (GLASOD). ISRIC, Wageningen, the Netherlands.
Pieri, C., J. Dumanski, A. Hamblin and A. Young, 1995. Land Quality Indicators. World Bank Discussion Papers. 315.
Rabbinge, R., 1993. The ecological background in food production . In: Crop protection and sustainable agriculture. John Wiley and Sons, Chichester (Ciba Foundation Symposium 177), pp. 2-29.
Rabbinge, R., 1995. Eco-regional approaches, why, what and how. In: Bouma et al. (eds.), Eco-regional approaches for sustainable land use and food production. pp. 3-11.
Sinclair, T.R., 1990. Nitrogen influence on the physiology of crop yield. In: R. Rabbinge, J. Goudriaan, H. van Keulen, F.W.T. Penning de Vries and H.H. Van Laar (Eds.) Theoretical production ecology: reflections and prospects. Simulation Monograph 34, Pudoc, Wageningen: pp. 41-55.
Stoorvogel, J.J. and E.M.A. Smaling, 1990. Assessment of soil nutrient depletion in sub-Sahara Africa: 1983-2000. 4 volumes. Report 28. The Winand Staring Centre for Integrated Land, Soil and Water Research, Wageningen, The Netherlands.
Stoorvogel, J.J. and E.M.A. Smaling, 1998. Research on soil fertility decline in tropical environments: integration of spatial scales. Nutrient Cycling in Agroecosystems 50: 153-160
Van der Pol, F., 1993. Soil Mining: An Unseen Contributor to Farm Income in Southern Mali. Bulletin 325. Amsterdam, The Netherlands: Royal Tropical Institute (KIT)
Van Diepen, C.A., C. Rappoldt, J. Wolf and H. van Keulen, 1988. CWFS crop growth simulation model WOFOST. Documentation version 4.1. Staff working paper SOW-88-01. Centre for World Food Studies (CWFS), Amsterdam-Wageningen.
WRR, 1995. Sustained risks: a lasting phenomenon. Netherlands Scientific Council for Government Policy. Reports to the Government 44.